Sources of Added Sugars in the Diets of American Children and Adults: NHANES 2007-2010
This report analyzes nutrition data from the National Health and Nutrition Examination Surveys (NHANES) conducted from 2007 to 2010, focusing on the sources of added sugars in the diets of children aged 2-18 and adults aged 19 and older. Utilizing extensive dietary interviews, the study identifies the foods and beverages contributing to added sugar intake. Added sugars, defined as those included during preparation or processing, do not encompass naturally occurring sugars. Insights from this research help assess adherence to dietary guidelines and inform public health strategies.

Sources of Added Sugars in the Diets of American Children and Adults: NHANES 2007-2010
E N D
Presentation Transcript
NHANES 2007-2010 food and beverage sources of added sugars in the diets of children (2 – 18 years) and adults (19+ years)
Background • Nutrition data from the 2007 – 2008 and 2009 – 2010 National Health and Nutrition Examination Surveys were used (≥2 years of age) • Ongoing survey conducted by the Centers for Disease Control and Prevention to obtain health and nutritional information from a nationally representative sample of Americans • The dietary interview component, What We Eat In America, uses an extensive 5 step interview to identify the foods consumed, the amounts, when and where consumed on the previous day • Food Patterns Equivalents Database (FPED) was used • FPED converts foods that are in the forms reported consumed to appropriate food pattern equivalents amounts, thereby providing means to assess the adherence of American diets to the Dietary Guidelines for Americans recommendations • Added sugars are defined in FPED as sugars that are added to foods as an ingredient during preparation, processing, or at the table. Added sugars do not include naturally occurring sugars present in milk and fruit
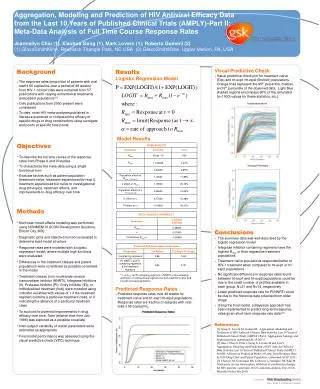
Added sugars intake from foods & beverages in the diets of children: NHANES 2003-2006 & 2007-2010 * Categorized as sweetened beverages NHANES 2003 – 2006 and 2007 – 2010, ages 2- 18 years
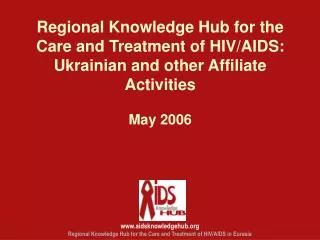
Food sources of added sugars in the diets of Children: NHANES 2007-2010 Teaspoon Equivalents of Added Sugars c * Categorized as sweetened beverages NHANES 2007 – 2010, ages 2- 18 years
Food sources of added sugars in the diets of children: NHANES 2007-2010 % of Total Added Sugars from Foods and Beverages c * Categorized as sweetened beverages NHANES 2007 – 2010, ages 2- 18 years
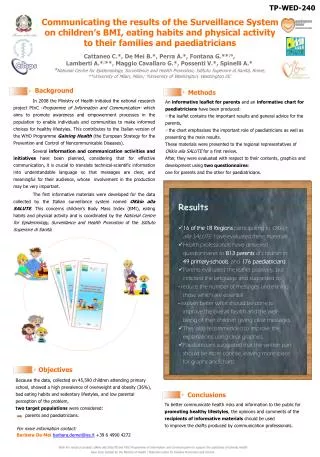
Food sources of added sugars in the diets of adults: NHANES 2007-2010 Teaspoon Equivalents of Added Sugars c * Categorized as sweetened beverages NHANES 2007 – 2010, ages 19+ years
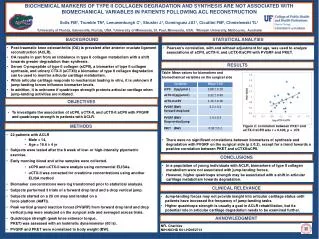
Food sources of added sugars in the diets of adults: NHANES 2007-2010 % of Total Added Sugars from Foods and Beverages * Categorized as sweetened beverages NHANES 2007 – 2010, ages 19+ years