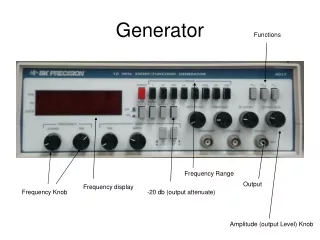
Dust Generator
A Field Wind Tunnel Study of Fine Dust Emissions in Sandy Soils. Matthew C. Baddock 1 , Jenny Jo Cox 2 , Ted M. Zobeck 1 , R. Scott Van Pelt 3 1 USDA-ARS Wind Erosion and Water Conservation Research Unit, Lubbock, TX 2 Texas Tech University, Lubbock, TX

Dust Generator
E N D
Presentation Transcript
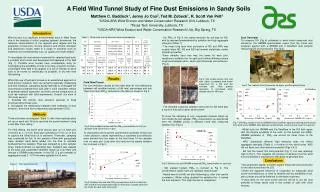
A Field Wind Tunnel Study of Fine Dust Emissions in Sandy Soils Matthew C. Baddock1, Jenny Jo Cox2, Ted M. Zobeck1, R. Scott Van Pelt3 1USDA-ARS Wind Erosion and Water Conservation Research Unit, Lubbock, TX 2Texas Tech University, Lubbock, TX 3USDA-ARS Wind Erosion and Water Conservation Research Unit, Big Spring, TX Introduction Wind erosion is a significant environmental issue in West Texas due to the interplay of cotton cropping systems’ dominance, the temporal characteristics of the regional wind regime and the properties of local soils. On-site (erosion) and off-site (transport and deposition) issues relate to a range of concerns such as sediment and nutrient/fertility loss, air quality and health effects. To investigate the dust emission potential for selected local soils, a portable wind tunnel was developed and deployed in the field (Fig 1). Portable wind tunnels have considerable utility for investigating the erodibility of soils since they a) permit a known, controllable wind field to be applied to a soil of interest b) allow soils to be tested as realistically as possible, in situ with their field setting. Whilst the use of field wind tunnels is an established approach in wind erosion research, their use remains logistically challenging and time intensive. Laboratory-based methods to investigate the dust emission potential from soils offer a more expedient means to estimate aerosol production, but there are few comparisons of such lab methods with field experiments. Overall, the aims of this study were to: 1. Estimate the intrinsic dust emission potential of three prominent West Texas soils. 2. Investigate the relationship between field estimates of dust emission, and those from a laboratory dust generator (DG). Three soils were investigated (Table 1), with three replicate plots set up on each soil. All plots received the same treatment using a roto-tiller, then raking. For field testing, the same wind velocity was run on each plot (12.6 m/s at z = 0.5 m). Each plot underwent a 5 min run of flow to capture the initial blow off of sediment. Thereafter, sampling was conducted for five 10 min periods of flow with geologically clean abrader sand being added into the flow to simulate bombardment by saltation. Flow was sampled by a slot sampler array, made isokinetic by aspirating fans. Saltation was trapped at the base and suspended sediment drawn up onto filters and through a GRIMM spectrometer. In the DG, 5 g soil samples of aggregates sized 2 - 4.75 mm were agitated for 20 mins. Table 1. Study soils texture data and measured properties • For PM10 in Fig 3, the lowest emission by soil was for ND, with its reduced bombardment by saltation and high aggregate strengths (Table 1). • The mean long term dust production of BS and ARS was roughly twice ND. BS and ND had several statistically similar strength properties. • Since abrader input rate was the same for each plot, variations in saltation flux for each point reflect differing surface roughness between plots, which also influences dust emission. (Fig 4). • The elevated sustained saltation rates seen for BS were also a result of that soil’s higher sand content. • To show the sampling of only suspended material drawn up from inside the slot sampler, PM10 concentration as determined from the GRIMM shows a different trend with measured saltation flux (Fig 5). • - ND yielded highest PM10 in contrast to Fig 3. The concentration values here are relatively small though. • Added here is the ND soil after flattening by roller (not used in correlation). Whilst rolling doubled the saltation flux, it halved the dust emission. This might be due to compaction. • Dust Generator • To compare DG (Fig 6) estimates to wind tunnel measured dust emissions, the GRIMM spectrometer output from the tunnel was analyzed against both a GRIMM and a DataRam dust sampler measuring DG dust production (Fig 7a,b). • Whilst both the GRIMM and the DataRam in the DG both agree with the relative erodibility of the soils, for the dustiest soil (ARS), GRIMM estimates of PM10 are around six times those of the DataRam. • ARS’ statistically different high emission does not reflect aggregate strengths (Table 1). In relation to the wind tunnel, ARS did not have such dust emission potential (Figs 3 & 5) • BS has the lowest DG dust potential (Fig 7), but was relatively high in Fig 3. This suggests the process of abrasion that the wind tunnel simulates is important for BS’ ability to generate dust. • Soil properties appear to better explain measured dust production for the wind tunnel than the DG. • Given the apparent influence of roughness on measured wind tunnel dust emissions, in order to observe intrinsicerodibility of soil, plot surfaces should be flattened to eliminate roughness. • Future work for the wind tunnel and DG will be to put the dust potential of these sandy soils in the context of soils with other textures. Field Wind Tunnel For dust emission caused by the initial blow off, the relationship between soil erodible fraction (<0.84 mm) percentage and sub 10µm size dust (PM10) collected on the filters is shown in Fig 2. To characterize the long term dust emission potential of each soil under abrasion, values representing a sustained dust emission were derived from the mean of the final three 10 min abrader runs on each plot. Long term dust emission by steady saltation flux is shown in Fig 3. Results Fig 4: Soil surface before (left) and after (right) a complete wind tunnel experiment for a BS and ND example plot. Note greater deposition of introduced white abrader sand for ND case Fig 6: The Lubbock Dust Generation, Analysis and Sampling System Methods a) b) Fig 7: DG PM10 emission from a) GRIMM and b) DataRam against sustained dust emission from wind tunnel GRIMM. Note different vertical scales. Crosses show mean for each soil Fig 2: Soil erodible fraction and filter PM10 concentration for first (no abrader) wind tunnel run on a plot Conclusions Fig 5: Saltation flux and GRIMM-measured PM10 concentration for each plot Figure 1: The field wind tunnel Fig 3: Saltation flux and total PM10 concentration (that from both the filter and the slot sampler base trap) for each plot. Crosses represent the mean for each soil’s three plots 6m 1m