Enhance Learning with Infographics: Visual Tools for Effective Communication
Discover the power of infographics in education! Infographics are visual representations of information, designed to communicate complex data quickly and clearly. With 65% of the population being visual learners, utilizing infographics can significantly improve cognition and learning outcomes. This resource covers why infographics are essential, how to create them effectively, and ways to apply them in educational settings. Learn to harness visual aids to engage students and transform learning. Visit us at Angry Bunny Publishing for more insights!

Enhance Learning with Infographics: Visual Tools for Effective Communication
E N D
Presentation Transcript
Presenter: Kelli Stair Author of VoiceThread for Digital Education https://www.smashwords.com/books/view/356369 and QRevolution (available for preorder) https://www.smashwords.com/books/view/368369 www.angrybunnypublishing.com Infographics Email: kellistair2013@gmail.com kellistair@angrybunnypublishing.com
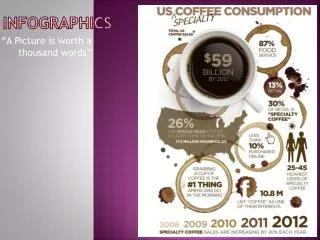
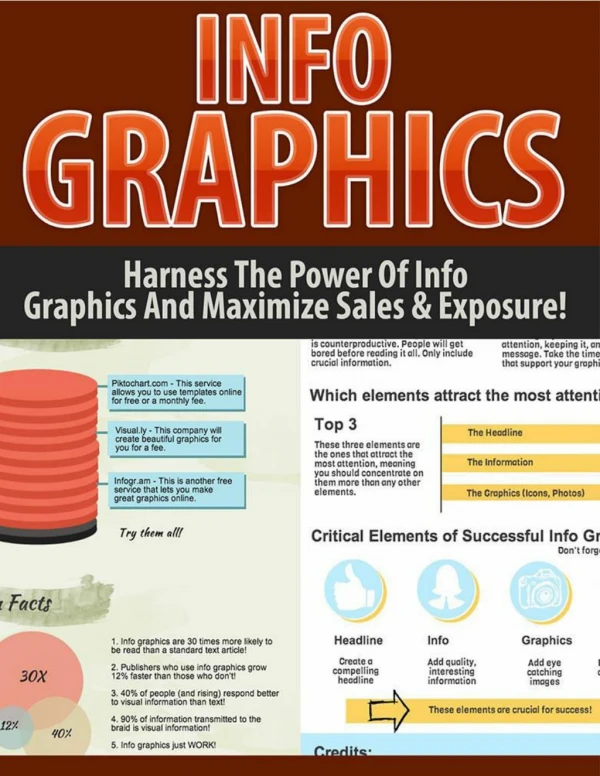
What’s an Infographic? • Information graphics or infographics are graphic visual representations of information, data or knowledge intended to present complex information quickly and clearly.[1][2] They can improve cognition by utilizing graphics to enhance the human visual system’s ability to see patterns and trends. • http://en.wikipedia.org/wiki/Infographic
Why Use Infographics? • FACT: Approximately 65 percent of the population are visual learners. - Mind Tools, 1998 • FACT: The brain processes visual information 60,000 faster than text. - 3M Corporation, 2001 • FACT: 90 percent of information that comes to the brain is visual. – Hyerle, 2000 • FACT: 40 percent of all nerve fibers connected to the brain are linked to the retina. – Jensen, 1996 • FACT: Visual aids in the classroom improve learning by up to 400 percent. - 3M Corporation, 2001 • FACT: Our eyes can register 36,000 visual messages per hour. – Jensen, 1996 • http://visualteachingalliance.com/
Resources • www.Dailyinfographic.com • http://www.cooldailyinfographics.com/ • http://visual.ly/ • http://readwrite.com/2013/06/10/5-tools-for-creating-your-own-infographics#awesm=~olctCoQ5Uec3OA
Glogster • http://edu.glogster.com/ • Example • http://leinen.edu.glogster.com/perspective/?=glogpedia-source • Example • http://soniamalik14.edu.glogster.com/muscular-system/?=glogpedia-source
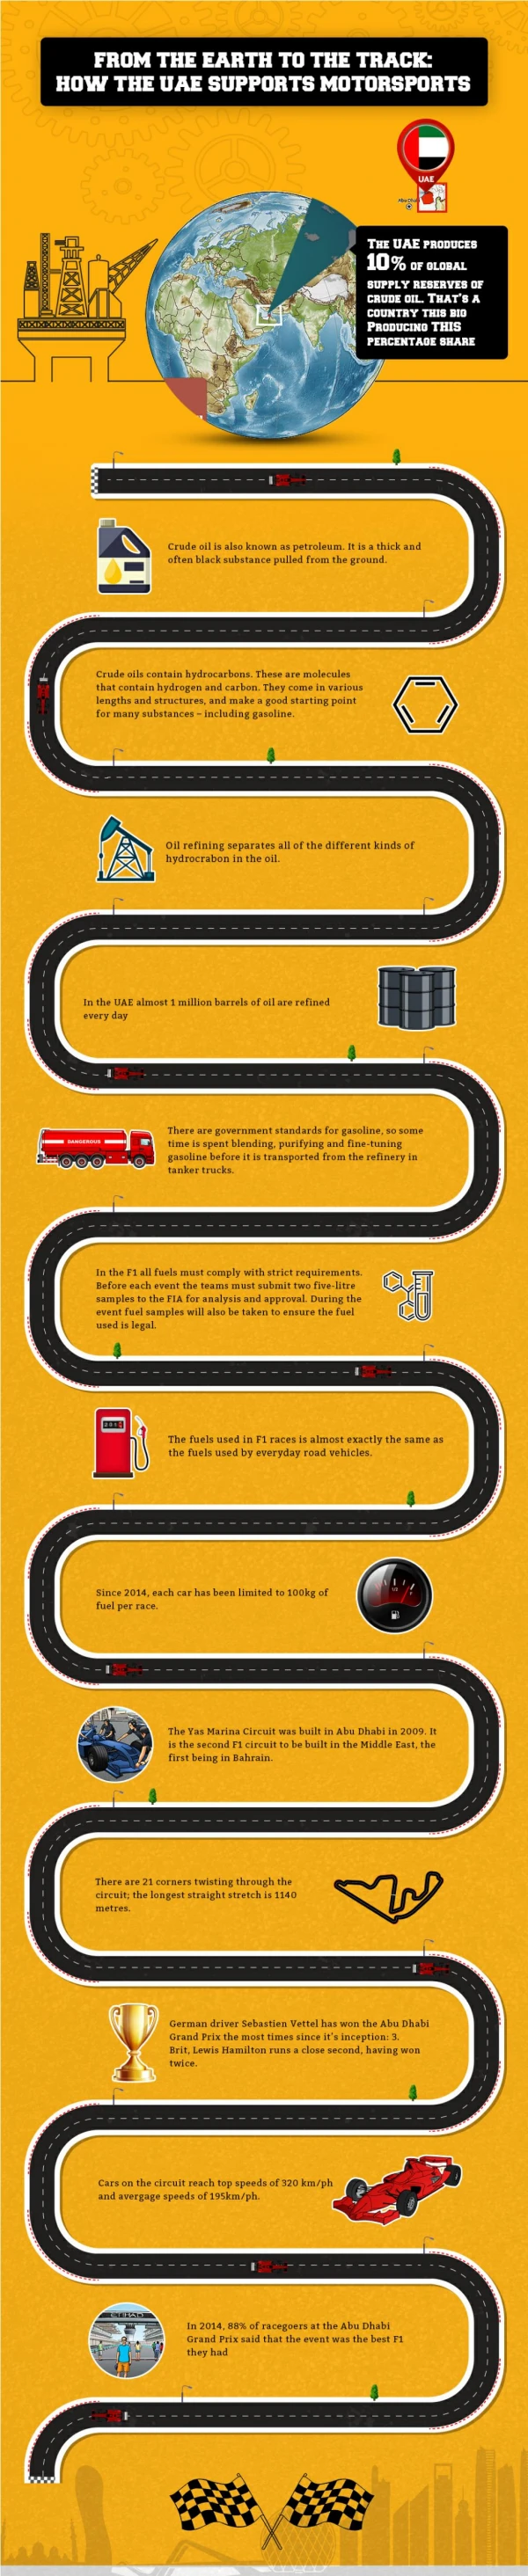
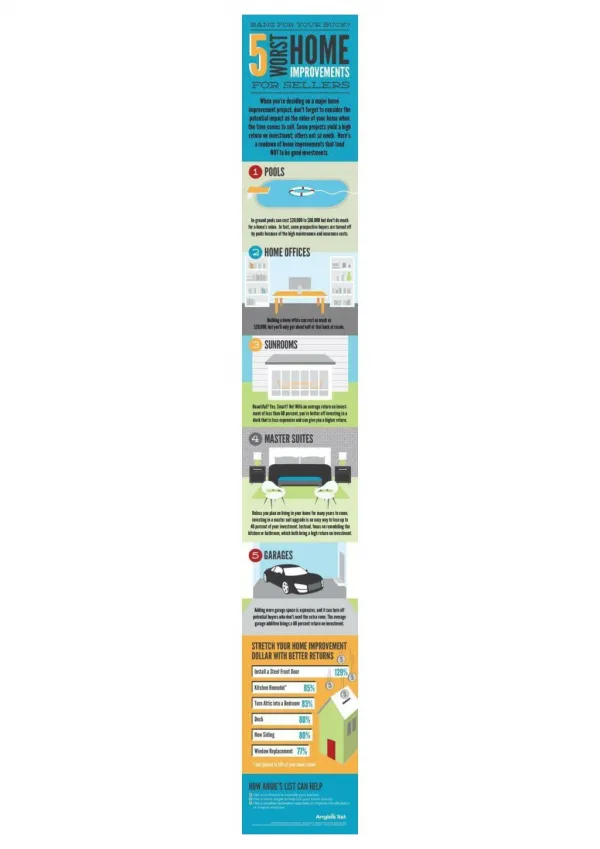
Creating Infographics • Find and curate (select) information to present • Visualize that information--try to use non-text representations such as images, charts, graphs, numbers, and videos • Organize so that the reader progresses through the information in a way that helps them learn, build, or grow ideas • Read like a book--top to bottom, left to right • Read from center outward—big to small like a concept map
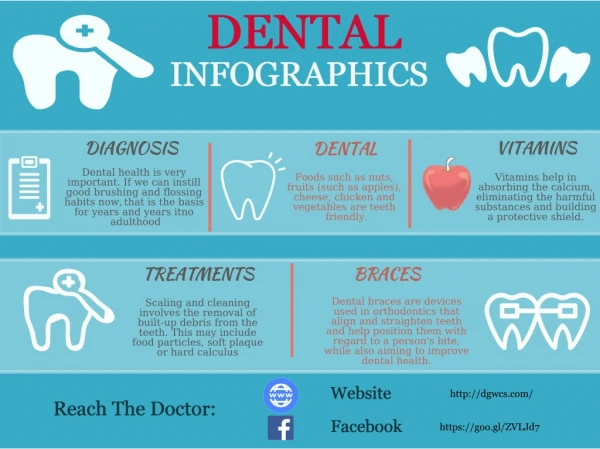
Uses for Infographics • Teachers: • Present information visually • Activate or level background knowledge before a unit • Teach or practice visual literacy strategies • Students: • Demonstrate learning • Projects, assignments, multimedia essays
Kelli Stair—Writer, Teacher Consultantwww.angrybunnypublishing.com • If you liked this presentation, you’ll love my eBook VoiceThread for Digital Education available now at • https://www.smashwords.com/books/view/356359 • Use coupon code ND26A for 40% off through the end of October. Feel free to share that coupon with other teachers, on your FaceBook page, or Twitter account. • Look for QRevolution coming November 25, 2013. • PreOrder for $2.99 at https://www.smashwords.com/books/view/368369