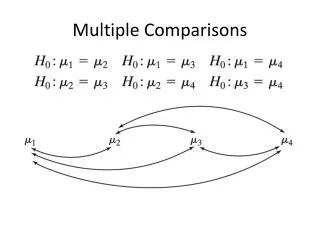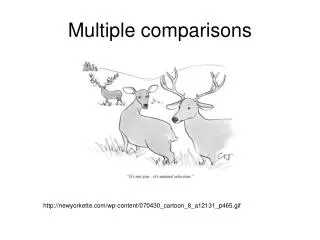
Multiple comparisons
Multiple comparisons. What do we do with a significant F ratio?. A priori (planned) comparisons. A priori comparisons are planned before the data are collected.

Multiple comparisons
E N D
Presentation Transcript
Multiple comparisons What do we do with a significant F ratio?
A priori (planned) comparisons • A priori comparisons are planned before the data are collected. • One strategy is to allow the Type I error rate for the study to rise, in order to maximize power and minimize Type II error rates. • For that strategy to be effective, make very few two-group comparisons -- the ones specified in your research hypotheses.
Planned comparisons • Another strategy for planned comparisons sets the a level lower than .05, in order to keep the experimentwise error rate at a. • For example, with three comparisons, set a at .0167, so that the total Type I error rate will be .0167 + .0167 + .0167 = .05 • That approach sacrifices power, and increases Type II error. Sound familiar?
Orthogonality in planned comparisons • Some scholars insist that planned comparisons must be orthogonal or independent. Only k - 1 comparisons can be orthogonal. • Orthogonal comparisons have coefficients which when multiplied together sum to 0: Contrast A: 1 -1 0 S = 0 Contrast B: .5 .5 -1 S = 0 Product (A x B): .5 -.5 0 S = 0
Using t for planned comparisons • Using either orthogonal contrast coefficients or a minimum number of contrasts (textbook approach), you could compare two groups using the independent samples t or ANOVA. t = M1 - M2 M1 - M2 SM1 -M2 SS1 + SS211 n1 + n2 - 2 n1 n2 But, since you already know MSW, use it: +
t with MSW t = M1 - M2 = M1 - M2 MSW 1 + 1 sW2 1 + 1 n1 n2 n1 n2 Obviously, if n1 = n2, the denominator simplifies to 2sW2/n
A posteriori tests • Several post hoc tests have been developed to find the differences between means if the ANOVA F ratio is significant. • Tukey’s HSD keeps the total Type I error rate (the experimentwise error rate) at a. • Newman-Keuls keeps the Type I error rate at a for each comparison.
Tukey’s HSD • Both Tukey and Newman-Keuls use the studentized range distribution, q, rather than t or F. qobt = Mi - Mj MSW/n where i refers to the larger mean and n is the sample size, with all samples being the same size..
Evaluating Tukey • Use table B-5 to find the critical value of q. • If qobt > qcrit, reject H0. If not, retain H0. • Analogous to the confidence interval approach, you can simplify multiple Tukey HSD tests by determining the size of the mean difference (Mi – Mj ) that is significant: • HSD = qMSW/n Any mean differences that equal or exceed HSD are significant.
Newman-Keuls test • Calculation of qobt is the same as for Tukey’s HSD. • The value of qcrit differs for each comparison, depending on r, the number of means encompassed by the two means being compared. • Compare qobt to the appropriate qcrit starting from the largest and moving down as far as necessary: Logic.
The case of unequal sample sizes • If sample sizes are not equal, but are not greatly different, either, you may use Tukey’s HSD or Newman-Keuls. • However, what value of n should you use in the equation? • Use the harmonic mean: • n = k . (1/n1) + (1/n2) + … + (1/nk) ~
The Scheffe test • This is a very conservative test, with relatively low power. • F is still equal to MSB/ MSW , but MSB is re-computed using only the two groups being compared. MSB = F is compared to the same critical value as for the ANOVA.
Type I Error and Power • Which of the three approaches has the highest risk of Type I error? • Which has the most power?