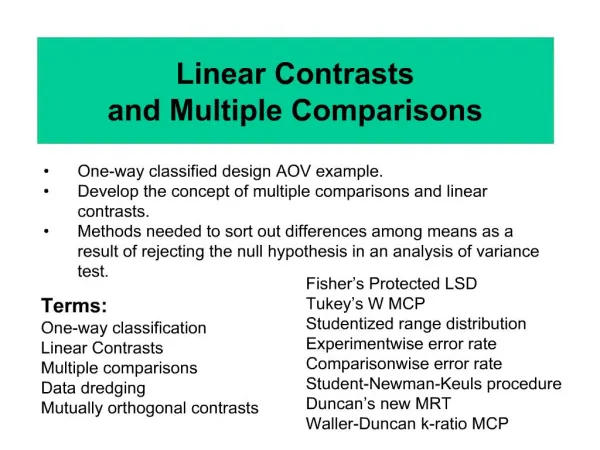
fMRI Multiple Comparisons Problem
The False Discovery Rate A New Approach to the Multiple Comparisons Problem Thomas Nichols Department of Biostatistics University of Michigan. fMRI Multiple Comparisons Problem. 4-Dimensional Data 1,000 multivariate observations, each with 100,000 elements

fMRI Multiple Comparisons Problem
E N D
Presentation Transcript
The False Discovery RateA New Approach to the Multiple Comparisons ProblemThomas NicholsDepartment of BiostatisticsUniversity of Michigan
fMRI Multiple Comparisons Problem • 4-Dimensional Data • 1,000 multivariate observations,each with 100,000 elements • 100,000 time series, each with 1,000 observations • Massively UnivariateApproach • 100,000 hypothesistests • Massive MCP! 1,000 . . . 3 2 1
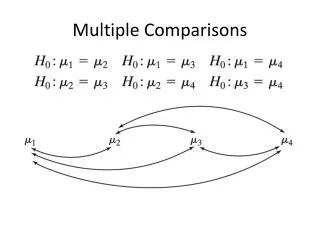
Solutions forMultiple Comparison Problem • A MCP Solution Must Control False Positives • How to measure multiple false positives? • Familywise Error Rate (FWER) • Chance of any false positives • Controlled by Bonferroni & Random Field Methods • False Discovery Rate (FDR) • Proportion of false positives among rejected tests
Signal False Discovery RateIllustration: Noise Signal+Noise
11.3% 11.3% 12.5% 10.8% 11.5% 10.0% 10.7% 11.2% 10.2% 9.5% 6.7% 10.5% 12.2% 8.7% 10.4% 14.9% 9.3% 16.2% 13.8% 14.0% Control of Per Comparison Rate at 10% Percentage of Null Pixels that are False Positives Control of Familywise Error Rate at 10% FWE Occurrence of Familywise Error Control of False Discovery Rate at 10% Percentage of Activated Pixels that are False Positives
p(i) i/V q/c(V) Benjamini & Hochberg Procedure • Select desired limit q on E(FDR) • Order p-values, p(1)p(2) ... p(V) • Let r be largest i such that • Reject all hypotheses corresponding top(1), ... , p(r). 1 p(i) p-value i/V q/c(V) 0 0 1 i/V JRSS-B (1995) 57:289-300
Benjamini & Hochberg Procedure • c(V) = 1 • Positive Regression Dependency on Subsets • Technical condition, special cases include • Independent data • Multivariate Normal with all positive correlations • Result by Benjamini & Yekutieli. • c(V) = i=1,...,V 1/i log(V)+0.5772 • Arbitrary covariance structure
Signal Intensity 3.0 Signal Extent 1.0 Noise Smoothness 3.0 Benjamini & Hochberg:Varying Signal Extent p = z = 1
Signal Intensity 3.0 Signal Extent 2.0 Noise Smoothness 3.0 Benjamini & Hochberg:Varying Signal Extent p = z = 2
Signal Intensity 3.0 Signal Extent 3.0 Noise Smoothness 3.0 Benjamini & Hochberg:Varying Signal Extent p = z = 3
Signal Intensity 3.0 Signal Extent 5.0 Noise Smoothness 3.0 Benjamini & Hochberg:Varying Signal Extent p = 0.000252 z = 3.48 4
Signal Intensity 3.0 Signal Extent 9.5 Noise Smoothness 3.0 Benjamini & Hochberg:Varying Signal Extent p = 0.001628 z = 2.94 5
Signal Intensity 3.0 Signal Extent 16.5 Noise Smoothness 3.0 Benjamini & Hochberg:Varying Signal Extent p = 0.007157 z = 2.45 6
Signal Intensity 3.0 Signal Extent 25.0 Noise Smoothness 3.0 Benjamini & Hochberg:Varying Signal Extent p = 0.019274 z = 2.07 7
Benjamini & Hochberg: Properties • Adaptive • Larger the signal, the lower the threshold • Larger the signal, the more false positives • False positives constant as fraction of rejected tests • Not a problem with imaging’s sparse signals • Smoothness OK • Smoothing introduces positive correlations
FDR: Example • Verbal fluency data • 14 42-second blocks • ABABAB... • A: Two syllable words presented aurally • B: Silence • Imaging parameters • 2Tesla scanner, TR = 7 sec • 84 64x64x64 images of 3 x 3 x 3 mm voxels
FDR Example:Plot of FDR Inequality p(i) ( i/V ) ( q/c(V) )
FDR: Example FDR 0.05Indep/PRDSt0 = 3.8119 FDR 0.05Arbitrary Cov.t0 = 5.0747 FWER 0.05Bonferronit0 = 5.485
FDR Software for SPM http://www.sph.umich.edu/~nichols/FDR
FDR: Conclusions • False Discovery Rate • A new false positive metric • Benjamini & Hochberg FDR Method • Straightforward solution to fNI MCP • Just one way of controlling FDR • New methods under developmente.g. C. Genovese or J. Storey • Limitations • Arbitrary dependence result less sensitive Start Ill http://www.sph.umich.edu/~nichols/FDR Prop
References • Benjamini Y, Hochberg Y (1995). Controlling the false discovery rate: A practical and powerful approach to multiple testing. Journal of the Royal Statistical Society, Series B, 57:289--300. • Benjamini, Y, Yekutieli D (2002). The control of the false discovery rate under dependence. Annals of Statistics. To appear. • Genovese CR, Lazar N, Nichols TE (2002). Thresholding of Statistical Maps in Functional Neuroimaging Using the False Discovery Rate. NeuroImage, 15:870-878.
Positive Regression Dependency • Does fMRI data exhibit total positive correlation? • Example • 160 scan experiment • Spatialautocorrelationof residuals • Single voxelwith all others • Negative correlationexists!