098
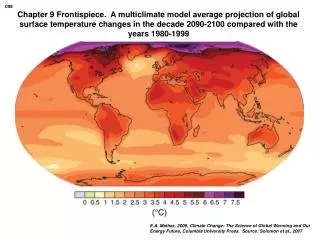
098. Chapter 9 Frontispiece. A multiclimate model average projection of global surface temperature changes in the decade 2090-2100 compared with the years 1980-1999.

098
E N D
Presentation Transcript
098 Chapter 9 Frontispiece. A multiclimate model average projection of global surface temperature changes in the decade 2090-2100 compared with the years 1980-1999 E.A. Mathez, 2009, Climate Change: The Science of Global Warming and Our Energy Future, Columbia University Press. Source: Solomon et al., 2007
099 Figure 9.1. Modeling global mean surface temperature E.A. Mathez, 2009, Climate Change: The Science of Global Warming and Our Energy Future, Columbia University Press. Source: Hegerl et al., 2007
100 Figure 9.2. Spatial distribution of observed warming compared with the distribution obtained from model simulations, 1902-2005 and 1979-2005 E.A. Mathez, 2009, Climate Change: The Science of Global Warming and Our Energy Future, Columbia University Press. Source: Hegerl et al., 2007
101 Figure 9.3. Projected changes in mean global surface temperature under three emissions scenarios E.A. Mathez, 2009, Climate Change: The Science of Global Warming and Our Energy Future, Columbia University Press. Source: IPCC, 2007
102 Figure 9.4. Projected changes in temperature, precipitation, and sea-level air pressure for winter (December-February) and summer (June-August), 2080-2099 E.A. Mathez, 2009, Climate Change: The Science of Global Warming and Our Energy Future, Columbia University Press. Source: Meehl et al., 2007
103 Table 9.1. Changes in the growth of carbon dioxide (CO2) emissions required by 2050 to bring about specific warming targets 2.5-30 350-400 445-490 2.0-2.4 2000-2015 -85 to -50 3.0-3.5 400-450 490-535 2.4-2.8 2000-2020 -60 to -30 3.5-4.0 440-485 535-590 2.8-3.2 2010-2030 -30 to +5 4.0-5.0 485-570 590-710 3.2-4.0 2020-2060 +10 to +60 5.0-6.0 570-660 710-855 4.0-4.9 2050-2080 +25 to +85 6.0-7.5 660-790 855-1130 4.9-6.1 2060-2090 +90 to +140 aCO2-eq is the concentration of CO2 that would have the same radiative forcing as the forcing due to all the greenhouse gases (CO2, methane, nitrogen oxide, ozone, halocarbons). b The equilibrium global mean temperature = temperature at the same time the climate finally stops changing (i.e. after all the committed warming has occurred) above the pre-industrial temperature. Change in Emissions By 2050 (% of 2000 Emissions) Additional Radiative Forcing (W/m2) Atmospheric CO2 Contents (ppm) Target Temperature Increaseb (°C) CO2-eq Contents (ppm)a Peak Year for Emissions E.A. Mathez, 2009, Climate Change: The Science of Global Warming and Our Energy Future, Columbia University Press. Source: IPCC, 2007