Transforming Hospitality: Reducing Energy Costs with Innovative Efficiency Solutions
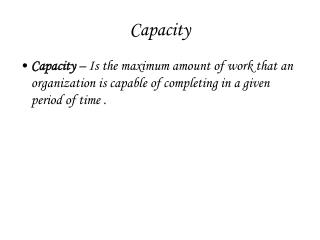
Rising electricity prices and government mandates are pressing the hospitality industry to enhance energy efficiency. With 15 million hotels worldwide, significant savings opportunities await, particularly in HVAC and lighting costs averaging $597 per room per year. Our Capacity solution can help major hotel chains reduce energy expenses by over 20%, fostering sustainability while enabling profitability. This innovative software-as-a-service model integrates seamlessly with existing systems, empowering hotels to efficiently manage energy consumption without heavy upfront costs.


Transforming Hospitality: Reducing Energy Costs with Innovative Efficiency Solutions
E N D
Presentation Transcript
Capacity Amy Haase Amit Shah TC Chang Travis Engelman Matt Grodin
Problem & Customer Problem: Increasing electricity costs Government mandates to monitor & reduce energy consumption Hotel expansions underway while economy tightens Ec0-savvy competition Customer: Hospitality Industry Demonstrated demand for energy efficiency systems Opportunity for large scale energy savings HVAC and Lighting alone cost $597/room/year Source: PKF Consulting Report
Market Size & Growth Market Size 15 million hotels worldwide Top 20 hotel chains owned by 10 groups Representing 18% of market (2.97 million rooms) Growth Target Customer Stats 2006-2008: Average expansion of 6% per year Average operating income increase of 12% per year Business objectives Implement Capacity solution across major hotel groups Enable hotels to experience significant savings (20+%) to mitigate rising electricity costs Help them help us make $$$ Source:http://www.mkg-hospitality.com
Business Strategy Competitive advantage / core differentiators: Software service model Outsourced hardware sold at or near cost (low-cost) Fluid integration with existing facilities systems
Value Curve Differentiation/competitive advantage from incumbent solutions: SW Web-based Control Commercial Capacity Agile, Lucid, Greenbox InnComm, Onity WiSuite, WattStopper, EnergyEye HW Non-web-based Sensing Residential
Market Forces Firm rivalry (medium threat – unique position) Complements (low threat – healthy eco-system in place) Hardware suppliers: sensors & data collectors; thermostats, meters, & networking equipment Installers Consultants Threat of new entrants (medium threat) HW-focused providers in the hotel energy monitoring industry can move towards a software focus. Metering, automation, or networking providers can develop specific solutions to target the hospitality industry. Substitutes (high threat) Other energy conservation solutions (solar, cogeneration / combined heat and power, water conservation efforts, water heating conservation efforts) Renovation Energy hedging Customer power (high threat – large chains with economies of scale) Supplier power (low – commodity components)
Solution Offering • Our solution does not force our customers to buy special thermostat rather it provides ability to make their existing thermostat and light controller enabled to do bi-directional data transfer • Rely on existing Wi-Fi networks at hotels, but also work with ZigBee alliance to incorporate new global wireless standard in energy monitoring and control • Our Software will be offered As a Service over WWW that will eliminate need for hotels to manage IT infrastructure, avail pay as you go expense model and instant scalability • Focus on business/operational intelligence from data that provides actionable list to reduce energy usage on permanent basis Source: http://buildings.lbl.gov/CEC/pubs/E5P22T1e_LBNL-53406.pdf
Product Features Demand Response (DR) Benchhmarking Features: • Notification: Notification of DR event via web-site, e-mail, phone, pager, cell phone, etc. • Online bidding: Bidding capability via web-site. • Event report: Track and report all events with saving kW and cost. • Baseline: Calculate baseline according to utility program formula. • Forecast: Predict electric load by other variables such as OAT. • Saving analysis: Cost estimation of expected utility bill saving using forecast and/or utility tariffs • Benchmarking: Benchmark usage against other building for same hotel chain or other hotel chains • Partnership Features: Provide partnership benefits to members for alternative energy solutions Source: http://buildings.lbl.gov/CEC/pubs/E5P22T1e_LBNL-53406.pdf Visualization/Analysis Features: • Day overlay: Overlay multiple days. • Average: Calculate average of specified period. • Highs/lows: Show max (peak) and min of the day or specified period in graph or tabular data. • Summary: Aggregate by week or month. • Point overlay: Plot multiple variables on same time series. • X-Y scatter: Plot of two points against each other to visualize relationship. • 3D chart: Plot of data point for vertical axis by hour – day horizontal axis. • Load duration: Sort and bin data for plotting load (or load factor) and hours at each load. • Calendar profile: Plot daily profiles of a month like calendar. • Aggregation: Aggregate multiple buildings or sub-meters. • OAT plot: Plot outside air temperature on a time series graph. • Per sqft: Normalize consumption by area for power/utility cost. • Forecasting: Forecast day-ahead loads.
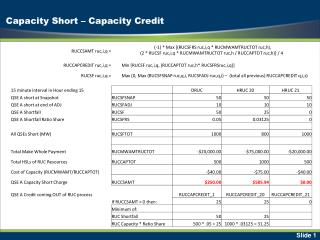
Resource Allocation and Funding Founder commitment: $1 M – Q1 2009 Series A: $4 M – Q1 2010 Total: $12.5 M Series B: $5 M – Q1 2011 Series C: $3.5M- Q1 2012 Series A Round Need: To further develop the hardware and software Series A Round Milestone: By Q1 2010 Capacity will have developed a working prototype of the transmitting module, base unit, and web application Series B Round Need: Necessary for the implementation of the first generation of software and hardware. The R&D headcount will continue to grow to 28 for 2nd generation (SW + HW) Series B Round Milestone: By Q1 2011 Capacity will have a contract with one major hotel chain with an installation date in early 2011. The product will be in a beta form that can be installed in Q1 2011. Series C Round Need: Directly to operations for rapid market adoption in 2012. R&D headcount will remain at (28) will transition to 2nd gen.
Return on Investment The premoney valuation in 2010 will be $19.6 M. In exchange for $4 M Capacity will exchange 17% of total equity. Exit strategy: Sell to big three of infrastructure Valuation: $75.3 M based on 3x P/S energy monitoring multiple $12.7 M on the investment which corresponds to a 55% IRR.