Download
1 / 4
40 likes | 175 Vues
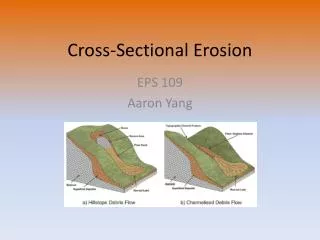
Fig1. Cross-sectional SEM image of the undercut sidewalls. 5. Results and Discussion. Fig.2. EL spectra of the fabricated LEDs. 6. Fig. 3. L-I-V characteristics of the fabricated LEDs. 7. Fig. 4. Near- field optical images of LEDs (a) with undercut sidewalls and

E N D
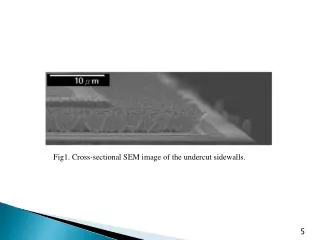
Fig1. Cross-sectional SEM image of the undercut sidewalls. 5
Results and Discussion Fig.2. EL spectra of the fabricated LEDs. 6
Fig. 4. Near-field optical images of LEDs (a) with undercut sidewalls and (b) with vertical sidewalls. 8