EFFECTIVENESS STUDY
Transportation . Management Plans. EFFECTIVENESS STUDY. Robert_Copp@dot.ca.gov. 1. “PREVIOUS SUCCESSES”. OLYMPIAD XXIII - 1984 Projections of Huge Traffic Jams / Images of Stranded Tourists Missing Events Residents “Scared” into Leaving Town Los Angeles Praised -“Great Planning!”.

EFFECTIVENESS STUDY
E N D
Presentation Transcript
Transportation Management Plans EFFECTIVENESS STUDY Robert_Copp@dot.ca.gov 1
“PREVIOUS SUCCESSES” • OLYMPIAD XXIII - 1984 • Projections of Huge Traffic Jams / • Images of Stranded Tourists Missing Events • Residents “Scared” into Leaving Town Los Angeles Praised -“Great Planning!” “People are Resilient AND Resourceful!” • SAN FRANCISCO EARTHQUAKE - 1989 • No Advance Warning • Motorists / Congestion Disappeared • Diversions Did Not Account for Total • “Where Did They All Go??” San Francisco Praised - “Great Work!” 2
STUDY PURPOSE • Evaluate District compliance with Guidelines • Evaluate Typical Measures of Effectiveness • Determine Most Effective Strategies • Evaluate Cost versus Benefit • Establish Lessons Learned • Formulate Recommendations to Improve TMP Process / Modify Guidelines 3
“We must get the most out of the roads we have before building any new ones…..well, duh!” Caltrans’ Mission To Improve MobilityAcross California 8 of 15 of the Most Congested Cities are in California 4
Construction Special Events WHAT’S THE POLICY? DEPUTY DIRECTIVE 60 (Eff. 2000) Maintenance Encroachment Permits Caltrans’ commitment is to: Minimize motorist delays for ALL activities on the State highway system without compromising public or worker safety, or the quality of the work being performed. 100% Compliance ..but with Varying Levels of Treatment.. 5
“Blanket” TMP “Major” TMP (~5% of Projects) Public Awareness Campaigns, Fixed CMS, Extended Closures, Moveable Barriers, COZEEP, Detours, Reduced Lane Widths, Website, Helicopter.. Night Work, Portable & Fixed CMS, COZEEP, TMT, HAR, FSP, Gawk Screens.. TMP CATEGORIES & STRATEGIES “Minor” TMP (Majority) • Minimal impacts caused by work • Lane closure charts required • Some mitigation measures required • Significant impacts caused by work • Multiple TMP strategies • Multiple contracts • No expected delays • Off peak • Low volume roads • Moving lane closures Portable CMS, FSP, TMT, Off-peak hours 6
TMP Costs for one Project were estimated as high as $7,000,000 Six TMP Strategies ublic Information • P • M • I • C • D • A otorist Information ncident Management onstruction Strategies emand Management lternate Routes 7
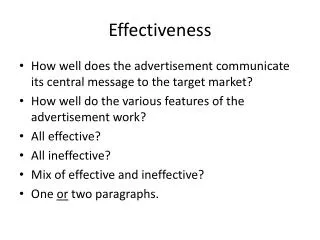
How Would You Measure the Effectiveness of TMP Strategies? Traffic Volume Counts, Floating Car Runs, Queue Lengths, Transit Ridership, Video Surveillance .. • Overall Corridor • Public Awareness • Motorist Information • Incident Management Personal or Mail-in Surveys, No. of Calls or Website Hits, Public Meeting Attendance .. Personal or Mail-in Surveys, Traffic Observations .. Accident Response / Removal Time, Pre- / Post- Accident Rates .. 8
Measurement of Effectiveness (Cont.) Traffic Volume Counts, Floating Car Runs, Queue Lengths, Lane Closures Set / Picked Up on Time .. • Construction Strategies • Demand Management • Alternate Routes Trip Mode Distribution, Park ‘n’ Ride Lot Usage, Carpooling Surveys, Employer Surveys .. Traffic Volume Counts Floating Car Runs, Origin/Destination Surveys .. 9
District 07 I-10 Long-Life Pavement Project Example of Corridor Effectiveness Results • Vehicle Delay • Traffic Volumes • Length of Queues • Safety Pre-Const. Estimate = 1,000,000 veh-hrs Actual Delay = 16,000 veh-hrs Example Traffic Demand on Interstate 10 was reduced by57% (from 112,000 to 56,000 veh) Initial Estimate = 44 miles Actual Queue Length = 1.9 miles No collisions or Employee injuries occurred in the Work Zone Project Characteristics - Fast-setting Hydraulic Concrete - Closed 2 of 4 Lanes - Extended 55-Hour Closures 10
District 07 I-10 Long-Life Pavement Project Actual Delay in Work Zone WithTMP Strategies Example (Initial Projected Delay = 1 Hour / Vehicle) (Delay in minutes) Sat. Sun. Rte 30/Foothill Blvd. 9 2 Arrow Highway 7 2 Holt Ave. 6 5 Mission Blvd. 3 2 Detour Rte 60 Freeway 20 34 Projected Delay Actual Delay 11
But.. WHICH strategies led to these Great Results?? 511 ? ? ? ? 12
MOST EFFECTIVE STRATEGIES - PUBLIC AWARENESS “If you drive I-80, you might want to consider an alternate route this morning..” “Which way should we go today..?” Use HOV, Bus or Rail Telecommute .. Leave Earlier or Later .. 13
Slogans AND Maps are Good and Easy to Remember.. “Improve Your Drive on the Five!” Instead of saying “Bridge Replacement Project” --... 14
What Did the Public Notice? Metro Traffic 511 Percentage District 04 Central Freeway Replacement Project Project Characteristics - Full-freeway Closure - On- and Off-Ramps Closed - Extensive Public Info Campaign Example 78% 32% 15
Location: Legend: Remarks: Effective Construction Strategies LANE REQUIREMENT CHARTS -Based on “0” delay (Const.) - 5 -15 minutes Delay (Maint.) - According to District Traffic Managers - eliminates about 90% of potential delay PROBLEMS - Const. windows reduced - More Night work (Urban/Rural) - Comparative Quality? - Comparative Safety? 16
Effective Construction Strategies (Cont.) • CONSTRUCTION STAGING • DELAY PENALTY --“Hammer” for the RE to charge the Contractor ($$$) for late pick-up of the closure . • EXTENDED CLOSURES(e.g. 55-Hour Weekends or 72-Hour Weekdays) • NARROW LANE WIDTHS or USE OF SHOULDERS (PEAK PERIOD) • MOVEABLE BARRIERS • CONTRAFLOW(“Crossovers”) • CONTINGENCY PLANS(Redundancy) 17
District 08 I-15 Devore PCCP Reconstruction Schedule Cost Comparison ($Millions) Max. Construction Comparison Delay Scenario (Min) Closure Total User Traffic Construction Total Handling Hours Closures Delay 72-Hour 8 512 5.6 10.5 2.1 18.2 75 Weekday 55-Hour 10 550 14.2 12.5 2.6 29.3 196 Weekend 1 Roadbed 2 400 6.9 8.9 1.0 16.8 196 Continuous 10-Hour 220 2,200 4.9 19.1 1.3 25.3 36 Night-time EXTENDED CLOSURE - Schedule, Cost & Delay Comparison Project Characteristics - Full-Freeway Closed - one direction - Extended 72-Hour Closures Example 18
District 05 Cuesta Grade Project Effective Strategies -- Demand Management Project Characteristics - Addition of NB / SB Truck-Climbing Lanes - Addition of Eight-foot Shoulders - Construction of massive Retaining Walls Example • NO. OF PEAK HOUR TRIPS • VAN POOL RIDERS • BUS TRIPS • PARK ‘N’ RIDE USAGE 4% Average Reduction 313% Increase 38% increase Strategy Cost = $3,300,000 29% Increase Strategy Cost = $780,000 19
City Streets Only - 11% No Longer Made Trip - 3% Public Transit - 2% Other - 2% Freeway / Transit - 3% Freeway / Streets - 2% Different Freeway or Ramp Route - 76% Freeway / Fewer Trips - 1% District 04 Central Freeway Replacement Project Alternate Route Strategies(Info obtained by Survey) Example 20
District 11 I-5 / I-805 Widening Project BENEFITS VS. COSTS??“Bang for the Buck...” $607,500 $835,000 $2,767,000 --- $400,000 $10,000 ublic Information • P • M • I • C • D • A otorist Information ncident Management onstruction Strategies emand Management lternate Routes COMPARE COST VS. DELAY SAVINGS Project Characteristics - Const. Separate Freeway Bypass - Const. of new Interchange / Auxiliary Lanes Example Strategy Cost COZEEP Cost = $1,700,000 Goal - Increase Van, Carpools, Bus by 5% / Change worktime by 2% 21
LESSONS LEARNED • PUBLIC AWARENESS • Newspapers • TV News Spots • ADVANCE SIGNAGE • Before Decision Points • On Preceding Weeks / Weekends • ADHERE TO LANE REQ’MT CHARTS • Real-Time Statusing is Needed • Penalties for Late Lane Opening • KEEP LANES OPEN • Narrow Lane Widths • Shoulder Usage during Peak PUBLIC AWARENESS: MOST Effective Strategies facilitate Decision-Making by Driving Public to avoid Work Zone CONSTRUCTION Strategies are also very effective 22
LESSONS LEARNED (cont.) Delay cost to motorists TMP Cost • CONSIDER OTHER STRATEGIES: • Extended Closures vs. Night Closures • (“Get in & Stay in -- Get out & Stay out!”) • Close Coordination w/ Locals (Detours, Signals…) • Shorten Contract Time through Incentives • COST VS. BENEFIT • $$$ on Work Zone Enforcement vs. Benefit ?? • $$$ on Brochures, Ads, Flyers, vs. Benefit ?? • (Media Coverage -- no cost for Major Projects) • Costs of TMP Strategies vs. Delay costs • OTHER ISSUES • Truck Restrictions / Closures on Parallel Routes • Cumulative Impacts due to Multiple Projects • (Combine closures when advantageous) 23
RECOMMENDATIONS • STREAMLINE TMP PROCESS • Blanket / Minor Projects (Standardized Forms) • Major Projects (Brief, Standardized Reports) • Critical Monitoring Activities - Delay Counts, Runs • PROPOSED STUDIES • Detailed TMP Effectiveness - Costs vs. Benefits • Full-Freeway vs. Night Closures • Enforcement Practices (Placement, etc.) • MODIFY TMP GUIDELINES • Standardize Monitoring Practices • Standardize Reporting Practices • Include Non-Motorized Considerations 24
Transportation Management Plans QUESTIONS?? Robert_Copp@dot.ca.gov 25
HANDOUTS • TMP Process • Relationship between Project • Characteristics and TMP Strategies • Sample Unit Costs for TMP Strategies • TMP Strategies -- Unit cost Info • Sample Worksheet -- Blanket TMP • Sample Delay Calculations A-1
Relationship between Project Characteristicsand Appropriate TMP Strategies A-3
Submit to the District Traffic Manager.. Example A-9