
EXAMPLE 1
EXAMPLE 1. Making a Box-and-Whisker Plot . Roller Coasters. The heights, in feet, of 10 suspended roller coasters in the United States are 35 , 42 , 42.5 , 60 , 60 , 70 , 76 , 78 , 81 , and 100 . Make a box-and-whisker plot of the data. SOLUTION. STEP 1.

EXAMPLE 1
E N D
Presentation Transcript
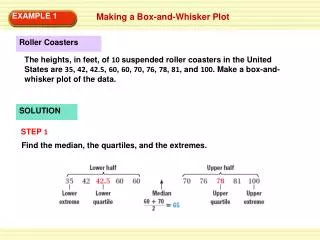
EXAMPLE 1 Making a Box-and-Whisker Plot Roller Coasters The heights, in feet, of 10 suspended roller coasters in the United States are 35, 42, 42.5, 60, 60, 70, 76, 78, 81, and 100. Make a box-and-whisker plot of the data. SOLUTION STEP 1 Find the median, the quartiles, and the extremes.
STEP 3 STEP 4 STEP 5 Draw a box connecting the quartiles. Draw a vertical line through the median. Draw “whiskers” from the box to both extremes EXAMPLE 1 Making a Box-and-Whisker Plot STEP 2 Plot the five values below a number line.
a. Suppose all of the watches under $31 are on clearance.About what fraction of the watches are on clearance? b. Suppose all of the watches from $31 to $71 are on sale. About what fraction of the watches are on sale? EXAMPLE 2 Interpreting a Box-and-Whisker Plot Watches The prices of the watches at a store are summarized in the box-and-whisker plot below.
a. The watches less than $31are about the same as the number in one of the whiskers, which represents about one quarter of the watches. The watches between $31 and $71are about the same as the number in the large box of the plot, which represents about halfof the watches. b. EXAMPLE 2 Interpreting a Box-and-Whisker Plot SOLUTION
One weekend, a theater sold the following numbers of tickets to each screening of a new movie. Make a box-and-whisker plot of the data. 1. 497, 429, 746, 469, 504, 464, 326, 302, 509, 467, 401, 499 300 400 500 600 700 800 302 415 468 501.5 746 for Examples 1 and 2 GUIDED PRACTICE
2. What If? ANSWER 50% for Examples 1 and 2 GUIDED PRACTICE In Example 2, suppose all of the watches under $45 were on clearance. About what fraction of the watches are on clearance?
3. In Example 2, is the number of watches between $71 and $120 greater than the number of watches between $16 and $31? Explain. ANSWER No , it should be the same because the watches between $71 and $120 represent about 25% of the watches and the watches between $16 and $31 also represent about 25% of the watches. for Examples 1 and 2 GUIDED PRACTICE
Bridges The lengths, in meters, of the world’s ten longest suspension bridges are listed below. How can you display these data to show how the lengths are distributed? EXAMPLE 1 Making a Box-and-Whisker Plot 1280 1490 1991 1377 1298 1210 1624 1158 1385 1410
Order the data to find the median, the quartiles, and the extremes. STEP 1 EXAMPLE 1 Making a Box-and-Whisker Plot Display the bridge lengths above in a box-and-whisker plot.
Plot these values below a number line. STEP 2 EXAMPLE 1 Making a Box-and-Whisker Plot
Food Science You are testing whether a fertilizer helps tomato plants grow. You divide the plants into two equal groups, and give fertilizer to the plants in Group 2, but not to Group 1. The box-and-whisker plots show how much the plants grew, in centimeters, for each group of plants after two weeks. EXAMPLE 2 Interpreting Box-and-Whisker Plots
a. About what fraction of the unfertilized plants grew as much as any of the fertilized plants? b. About what fraction of the fertilized plants grew 4 to 8 centimeters? a. The right whisker for Group 1 overlaps the left whisker for Group 2. So about one quarter of the unfertilized plants grew as much as any of the fertilized plants. b. The large box in the plot for Group 2 ranges from 4 to 8, so about one half of the fertilized plants grew 4 to 8 centimeters. EXAMPLE 2 Interpreting Box-and-Whisker Plots SOLUTION
Exercising Over a period of ten days, Ming exercised for 34, 27, 26, 15, 24, 21, 30, 23, 24, and 35 minutes. Chantelle exercised for 26, 33, 36, 21, 41, 36, 29, 25, 34, and 35 minutes. Make a box-and-whisker plot of the data for each person. 1. for Examples 1, 2 and 3 GUIDED PRACTICE
2. Who usually exercised longer? Explain. ANSWER Chantelle. Sample answer: The median workout time for Chantelle is longer than the third quartile time for Ming, and almost as long as the upper extreme for Ming. for Examples 1, 2 and 3 GUIDED PRACTICE
ANSWER about half the time for each for Examples 1, 2 and 3 GUIDED PRACTICE About how often did each person exercise for 25 –35 minutes? 3.


