Download
1 / 17
170 likes | 422 Vues
Why are case studies useful ?. Science – practice is hard !. Climate change predicted effects on coastal runup lines near Blouberg - Theron, Diedericks, Maherry and Rossouw, CSIR 2010. What can case studies teach us?. How users similar to ourselves have used climate change information

E N D
Science – practice is hard ! Climate change predicted effects on coastal runup lines near Blouberg - Theron, Diedericks, Maherry and Rossouw, CSIR 2010
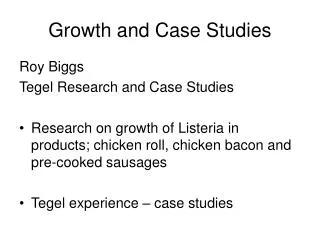
What can case studies teach us? • How users similar to ourselves have used climate change information • Things we can do differently • Data limitations Illustrate by first case study as example; Anna - will review other case studies and the process
Archer, E. ; Tadross, M. ; Opperman, D ; Conrad, J. , Venter, J. & Münch, Z. Climate change and commercial agribusiness in the arid Sandveld, western South Africa.
Background • Project commissioned by Cape Nature Greater Cederberg Biodiversity Corridor (GCBC project); Potato SA & Rooibos Council – establishing best practice guidelines (biodiversity-business) for intensive commercial farming in a sensitive and biodiverse environment • Understanding climate change projections and implications for potato & rooibos farming in the Sandveld • Climate change may challenge best practice in the region.
The Greater Cedarberg Biodiversity Corridor (Cape Nature) - At transition zone between Fynbos & Succulent Karoo - Northern Sandveld a key lowland biodiversity area Yet…
An area of intensive commercial agriculture Host to intensive potato & rooibos production – key economic activities in this area Cape Nature: -over past 15 years, ave 2.7 ha of Sandveld cleared for agriculture per day i.e. > 50% natural Sandveld habitat already transformed Low rainfall & nutrient poor soils; Thus commercial agriculture requires - high groundwater abstraction - high amts fertilizers
Sandveld climate history In an already sensitive and pressured environment … What of the future?
Background to available climate change data • Typical experience when requesting information on climate change • Value of bringing the projections data into GIS • Decentralized analysis – part of point of Winter School (whether in Climate Change Explorer, GIS, or any other tools)
Information required by users – Potato South Africa • Initial idea to link yields and climate • Data not robust enough; alternative • Driving a groundwater stress model with climate change Focus on right hand side in partnership with GEOSS; Hope to focus on left hand side in future (relative humidity, T & wind speed anomalies)
Information required by users – Rooibos • Autumn & Winter rainfall (April & Aug - Sep months) • Summer rainfall (Dec – Feb) • Relative humidity anomalies • Wind speed anomalies • Attempted to drive rooibos area suitability map with scenarios (Elsenburg partnership) – unfeasible • Hope to undertake as part of Volkswagen project 2009
Examples of information provided • Provided in participatory format; bilingual presentation (always info requested – prev slides); • GIS data provided + graphics and explanations; • Limitations (explained to user): • Look at change direction, not magnitude • Don’t average models • Don’t interpret for one single point • Some technical tasks remaining
Projected temperature anomalies One downscaling as an example, but two used.
Groundwater recharge depth anomaly Groundwater recharge depth calculated based on rainfall anomaly using 5 downscalings Three later period downscalings (CSIRO, ECHAM & HADCM3) all indicate increased recharge to the east Possibly due to increases in summer rainfall?
Example of take home messages for the Sandveld • 5 out of 6 models show reduced April rainfall • 5 out of 6 models show reduced August rainfall • warmer monthly average temperatures, minimum temperatures & maximum temperatures – particularly towards the interior • All models show reduced groundwater recharge under climate change. • Thoughts – what might a combination of increased temperatures, lower rainfall and reduced groundwater recharge mean for this area?
Discussion & research challenges • Existing stresses may be exacerbated, perhaps critically • Heat and water stress likely to increase Remaining work: • What’s missing? • Working with updated downscalings Taking such work forward in the Sandveld