Interactive Visual Data Mining Modeling to Enhance Understanding and Effectiveness of the Process
430 likes | 626 Vues
Interactive Visual Data Mining Modeling to Enhance Understanding and Effectiveness of the Process. Dr. Yan Liu Department of Biomedical, Industrial and Human Factors Engineering Wright State University. Outline. Background Research Objectives and Significance Conceptual Model Hypotheses

Interactive Visual Data Mining Modeling to Enhance Understanding and Effectiveness of the Process
E N D
Presentation Transcript
Interactive Visual Data Mining ModelingtoEnhance Understanding and Effectiveness of the Process Dr. Yan Liu Department of Biomedical, Industrial and Human Factors Engineering Wright State University
Outline • Background • Research Objectives and Significance • Conceptual Model • Hypotheses • Design of Interactive Visual Decision Tree Classification and Association Rules Modeling • Experiments • Conclusions
Data Mining (DM): What and Why • What Is DM • A synonym for knowledge discovery in databases (KDD) • Nontrivial process of identifying valid, novel, potentially useful, and ultimately understandable patterns in data (Fayyard et al., 1996) • Lying at the interface of database management, machine learning, pattern recognition, statistics and visualization • Why Is DM Useful • Rapid development of information techniques produces vast amounts of data • Knowledge discovered from data can be use for competitive advantage • Classification, prediction, association, clustering, etc.
Data Understanding Business Understanding Data Deployment Data Preparation Evaluation Modeling Data Mining Process CRISP-DM (CRoss Industry Standard Process for DM) (Holsheimer,1999)
Data Mining Process (Cont’d) • Business Understanding • Understand the objectives • Define performance criteria • Objective or subjective • Assess current situations of the organization • Background knowledge, data sources, resources, etc. • Data Understanding • Collect data • From scratch or existing databases • Describe data • Volume, identities of attributes, format, etc. • Explore/survey data • Distributions of attributes, relations among a small number of attributes, results of simple aggregations, etc. • Statistical analysis, data visualization, database queries can be useful tools • Verify data quality • Incomplete data, missing values, errors, etc.
Data Mining Process (Cont’d) • Data Preparation • “Garbage in, garbage out” • Select data • Based on relevance, technical constraints • Clean data • remove errors, fill in missing data with default values or estimates by modeling • Construct data • Generate new attributes (records), merge tables, transform data, etc. • Reduce data • Obtain a dataset much smaller yet retaining enough important information
Data Mining Process • Modeling • Select appropriate modeling techniques • Supervised Learning (directed DM) • Explanatory variables and one or more dependent variables • Learn the relationship between the explanatory variables and dependent variables • Decision trees, artificial neural networks, Bayesian classification, support vector machines (SVMs), regression, etc. • Unsupervised learning • No distinction between explanatory and dependent variables • Understand relationships within the dataset • Cluster analysis, association rules, self-organizing map, principal component analysis, etc. • Generate test design • Test models’ quality and validity • Build models • Assess models • According to domain knowledge, success criteria and test design
Data Mining Process (Cont’d) • Evaluation • Evaluate results • With respect to the project objectives • Review process • Overlooked important factors or tasks • Deployment • Plan deployment • Plan monitoring and maintenance • Produce final report
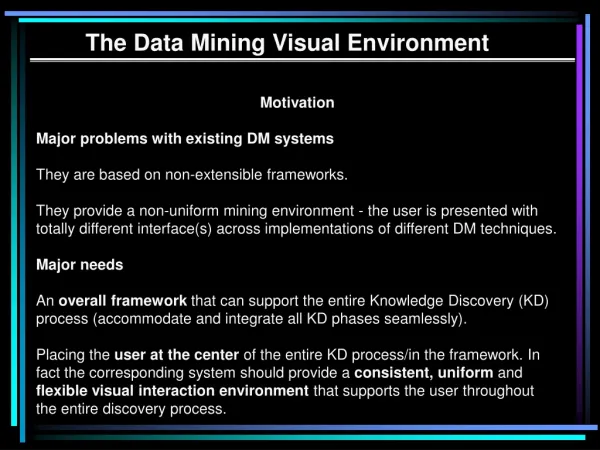
DM Modeling • Automatic DM Modeling • Little interaction with the computing machine • May lead to unproductive process (Meneses & Grinstein,2001) • Downplay the key roles played by humans (Brachman & Anand,1996) • Understanding of the outputs • Guiding the discovery process • Interactive Visual DM Modeling (IVDMM) • Involvement of Users in Constructing Models • Data visualization • Visualization of intermediate outcomes • May Better Understandings of Models • May Improve Effectiveness of Modeling
Objectives and Significance • Objectives • Identify the key visualization components in IVDMM • Study how to display them • Significance of Research • Theoretical • Framework of integration of analytical DM techniques and information visualization • Research topics for future exploration • Practical • Innovative visualization methods • Design guidelines
Hypotheses • Hypotheses I, II, and III • Compared to automatic model construction, interactive visual model construction through integrated visualization of model-building process and data visualization • Improves the effectiveness of modeling (Hypothesis I) • Enhances understanding of the applied DM algorithm (Hypothesis II) • Brings users greater satisfaction (Hypothesis III) • Hypothesis IV • Compared to nonintegrated visualization of derived models and data visualization, integrated visualization of derived models and data visualization • Promotes better understanding of models (Hypothesis IV)
Interactive Visual Decision Tree Classification Interactive Visual Association Rules Modeling
Interactive Visual Decision Tree Classification(IVDT) • Classification • Distinguish data classes in order to predict unknown class labels • Decision Tree Classifier • Tree structure consisting of leaf and decision nodes • Process • Selecting the splits • Information gain, Gini index, Chi-square • Determining the size of the tree • Pruning • Classification accuracy in validation dataset
Visualization of Trees • Overall structure • Numbers of layers and nodes, relationships among nodes • Content information associated with nodes and splits • Number of records and class distribution • Car Dataset • University of California Irvine (UCI) Machine Learning Repository • Input attributes • Buying Price, Maintenance Price, Number of Doors, Number of Persons, Safety • Class attribute • Acceptability
Icicle Plot of a Tree Model • Familiarity (Barlow & Neville, 2001) • Ease of identification of tree structures (Barlow & Neville, 2001) • Effective demonstration of node sizes and class distribution (Cleveland & McGill, 1987) • Relatively effective in space usage (Liu & Salvendy, 2005)
Interactive Visual Decision Tree Construction • Length and positions along a common aligned scale are effective in visualizing quantitative information(Cleveland & McGill, 1987)
Integration of Data and Tree Visualizations • Drill-through is an effective integration technique(Sprenger et al., 1998; Thearling et al., 2002)
Thursdays => + => Interactive Visual Association Rules Modeling (IVAR) • Association Rules Modeling • Finds interesting associations or correlation relationships among items (binary attributes) • In the form of “if-then” statements • Measures • Support (A=>B) = Pr (A and B) • Confidence (A=>B) = Pr (B|A) • Process • Generate all combinations of items whose support values meet the support threshold (large itemsets) • From each large itemset, generate all rules that satisfy the confidence threshold Antecedent => Consequent
Visualization of Association Rules • Mappings of items • One-to-one, one-to-many, many-to-one, many-to-many • Interestingness measures of rules • Support, confidence • Zoo Dataset • University of California Irvine (UCI) Machine Learning Repository • Items • No Leg, Two Legs, Four Legs, Six Legs, Backbone, Toothed, Egg, Feather
Rule-to-Item Matrix View of Association Rules • Can display all types of mappings • Effective in visualizing interestingness measures(Cleveland & McGill, 1987) • Easily view rules associated with specific items(Wong et al., 1999)
Interactive Visual Association Rules Derivation Visualization of Single Items
Interactive Visual Association Rules Derivation Itemset-to-Item Matrix View of Two Itemsets • Consistent displays of graphics enhance their dissemination, accuracy, and ease of comprehension(Hix & Hartson, 1993)
Interactive Visual Association Rules Derivation Visualization of Rules with Two Items
Experiment One • Hypotheses • Compared to automatic model construction, interactive visual model construction through integrated visualization of model-building process and data visualization • Improves the effectiveness of modeling (Hypothesis I) • Enhances understanding of the applied DM algorithm (Hypothesis II) • Brings users greater satisfaction (Hypothesis III) • Participants • 20 Graduate engineering students • 10 males, 10 females • Age: mean 27.1; std. dev = 3.63 • Apparatus • Dell UltraSharp 1905FP 19-inch monitor
Procedure • Tutorial • Training • Practice • Formal Task • 20 minutes • Datasets • German Credit dataset (Stalog database) • Flag dataset (UCI machine learning repository) • Post-study • Independent Variable • Type of DM modeling construction • Decision Tree Classification • Compare IVDT with SAS Enterprise Miner (EM)-tree • Also compare with C4.5, CHAID (Chi-square Automatic Interaction Detector), and CART (Classification and Regression Tree) in hypothesis I • Association rules modeling • Compare IVAR with automatic modeling applied in current DM tools
(Eq. 1) α=1; β=0.5 (Eq. 2) r=1,2,3,4, or 5; α=2 • Dependent Variables (Cont.) • Effectiveness of modeling • Effectiveness of decision tree classification (EDT) = • Effectiveness of association rules modeling (EAR) = • Understanding of applied algorithms • Algorithm Understanding Questionnaire (Dunsmore and Roper, 2000) • 7 questions – 6 multiple-choice questions and 1 ordering question • Satisfaction with task • Modeling satisfaction questionnaire (Hackman and Oldham, 1975) • 9 seven-point likert-scale questions • Statistical Design • One-way between-subject design
Results • Hypothesis I • Decision trees classification F(1,18)=18.61; P=0.0004
Results • Hypothesis I • Decision trees classification
Results • Hypothesis I • Association rules modeling F(1,18)=397.57; P<0.0001
Results • Hypothesis II • Decision trees classification F(1,18)=24.59; p<0.0001
Results • Hypothesis II • Association rules modeling F(1,18)=29.14; p<0.0001
Results • Hypothesis III • Decision tree classification Cronbach alpha =0.89
Results • Hypothesis III • Association rules modeling Cronbach alpha =0.86
Experiment Two • Hypothesis • Compared to nonintegrated visualization of derived models and data visualization, integrated visualization of derived models and data visualization • Promotes better understanding of models (Hypothesis IV) • Participants • 10 students who took part in experiment one • 5 males, 5 females • Age: mean 26.7; std. dev 3.09 • Apparatus • Same as experiment one
Procedure • Tutorial • Training • Practice • Formal Task • 5 tasks (at most 5 minutes for each task) • Datasets (same as Experiment one) • Post-study • Independent Variables • Type of Visualization Interface (integrated vs. nonintegrated) • Type of task (5 levels) • Decision tree classification • Find characteristics of the data corresponding to leaf nodes • Compare characteristics of training data and validation data • Association rules modeling • Find characteristics of the data supporting rules
Dependent Variables • Task completion time • Correction rates • Statistical Design • Two-factorial within-subject design • Results • Decision tree classification • Integrated interface significantly reduced task completion time (p<.0001) and increased correction rates (p<.0001) • The advantage of the integrated interface over the nonintegrated one was more significant when examining data for nodes at lower levels and when comparing characteristics of training and validation data • Association rules modeling • Integrated interface significantly reduced task completion time (p<.0001) and increased correction rates (p=0.05) • The advantage of the integrated interface over the nonintegrated one was more significant when examining data supporting rules with larger support
Conclusion • Compared to Automatic Modeling, IVDMM Can • Improve effectiveness of modeling • Enhance understanding of applied algorithms and derived models • Bring users greater satisfaction • IVDMM is to Complement Automatic Modeling, Instead of Replacing It • Automatic modeling takes much less time • Effectiveness of modeling process can be greatly affected by users’ perceptual and cognitive abilities • Combining IVDMM and automatic modeling can be advantageous