Unlocking Insights Through Process Data Mining: Modern Techniques for Optimization
Discover how Process Data Mining can revolutionize your business by uncovering hidden relationships within your operational data. This approach facilitates knowledge discovery from both human activity and system behavior, allowing for superior understanding of process dynamics. Learn to monitor abnormal behavior, predict maintenance needs, and optimize performance variables like yield, cost, and throughput. By harnessing real-time data and modeling normal behavior, businesses can enhance efficiency and reduce costs compared to traditional SPC methods. Enhance your decision-making with effective data mining techniques!

Unlocking Insights Through Process Data Mining: Modern Techniques for Optimization
E N D
Presentation Transcript
Process Data Mining Geoff C Jones
Data Mining using modern techniques • The truth is out there - in our plant data! • But how can we find it, and how do we get to understand it? • Is my process running normally? • Is that QC result correct for my operating conditions? • Can I predict when that column needs cleaning?
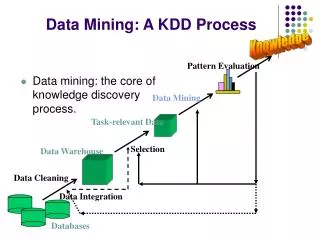
What do we mean by Data Mining? • Knowledge discovery from human activity (‘information from data’) • Consumer surveys, loyalty cards, credit history • Modelling behaviour - identifying relationships & trends • Prediction of buying habits, risk, etc How does Process Data Mining differ? • Knowledge discovery from systems behaviour • Data capture (on-line process & QC data) • Modelling of normal behaviour (exploratory data analysis) • Monitoring for abnormal behaviour • Prediction of quality, yield, fouling, catalyst deactivation, etc
How Can It Benefit My Business? • It enables the relationships between process and performance variables to be identified, that influence: • Yields & usages • Processing times, speed, throughput • Product impurities • Cost is low compared with the benefits
How does it differ from Conventional Process Control & SPC? • Closed-loop control: • deals with dynamic behaviour • requires sampling rate much higher than system frequency response • requires cause-effect relationships to be known • SPC: • (generally) deals with steady-state systems • sampling rate determined by cost of data collection • identifies non-random system behaviour (variation due to assignable causes) • usually configured for univariate monitoring • Process Data Mining: • identifies relationships and abnormalities in multivariate systems for process optimisation and troubleshooting • three stages: exploration, modelling, validation
What do I need to achieve this? • For modelling normal behaviour: • Access to historic time-stamped process & QC data • example BASF Seal Sands plant: • over 2 full years PI data for >11,000 variables, every 30 seconds • Some knowledge of what variables to monitor • Some expectation of what is to be achieved • Understanding the data • For monitoring abnormal behaviour: • A model of normal behaviour • Real-time data access • Software to identify causes of abnormal behaviour
Integrated network access to historic time-stamped process & QC data • Majority of process control systems (DCS & PLC) have interfaces to external systems: • normally offer ‘firewall’ security to prevent unauthorised write-back • normally offer network connectivity • Ethernet, TCP/IP, browser-configurable • Major data historian packages have standard interfaces to these systems: • client - server • data compression comes as standard • can import QC data • clients run on same platform as business systems • GUI, Excel add-in, API & web browser • Data historian systems may be plant-dedicated, shared over a business WAN, or shared over the Internet.
Internet Service Delivery Web Server Service Provider’s LAN PI Server LAN Firewall DMZ Internet FW Internet Internet FW DMZ LAN Firewall I/F Server Customer’s Business LAN DCS PC Business Network Service Delivery
Some expectation of what is to be achieved: • High Profile Targets: • % Yield Improvement • % Give-away reduction • % Utility usage reduction • % Rate or batch-speed increase • Side benefits: • Reduced ‘Grey’ material when changing grades • Reduced downtime • Reduced inventories awaiting analysis - sell from line • On-line monitoring of catalyst deactivation and process fouling
Constraint Poor control Improved control £ Move closer to constraint £+ Mean Process variable Time
Quantifying the improvement: AFTER 5% violation Dx BEFORE Dx = 1.65(s - s ) new old
Understanding the data: • To deal with abnormalities in the data: • Pre-Screening • Visualisation • Time-shift correction • Missing values • Outliers • Exploratory data analysis: • Projection Techniques (Chemometrics) • Clustering • Principal Component Analysis (PCA) • Regression • Least Squares (PLS)
Time-shift correction Raw data Cross-correlation Relationship now obvious No identifiable relationship Time-shifted cross-correlation
Sample with large T2 Unusual variation inside the model Sample with large Q (or SPE) Unusual variation outside the model First PC 6 4 Variable 3 Second PC 2 6 0 6 4 4 Variable 1 Variable 2 2 2 0 0 Ack to Eigenvector Research Inc.
Multivariate data analysis - correlation & clustering Outlier Outlier Highly correlated data
Real-time Modelling • Modelling for monitoring: • A subset of historic data is chosen which represents: • ‘common-cause’ process behaviour (no outliers) • the process operating within ‘control’ • The model will then be sensitive to outliers & out-of control data • Easier to say than it is to do: • many processes are ‘multi-modal’ • rate & grade changes - known as co-variates’ • co-variates must be ‘orthogonalised’ first, to give model sensitivity
Real-time modelling • Modelling for prediction: • Can include ‘richer’ process data for better prediction away from normal operation (but excluding outliers) • Must be validated on unseen data • Model drift is a problem, as processes change with time: • Difference between predicted & actual used for monitoring fouling & catalyst deactivation • Can be used to validate QC data
A selection of available software • Excel • Data analysis add-in - Moving Average, StDev, MLR • VBA programmable - on-line applications are possible • Matlab (statistics toolboxes including PCA & PLS) • http://www.ncl.ac.uk/inpact/ • http://www.eigenvector.com/ • can also be programmed for on-line monitoring • MSPC+ (off & on-line - uses embedded PI database) • http://www.mdctech.com/mspc.htm • Pirouette (exploratory data analysis) & InStep (prediction) • http://www.infometrix.com/ (demo available to download) • SIMCA-P (modelling) & SIMCA 4000 (on-line) • http://www.umetrics.com/ (demo available to download)