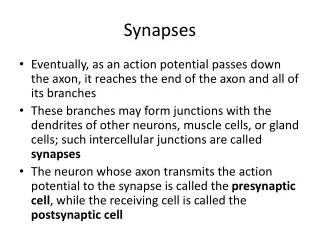
Electrical Synapses
Electrical Synapses. Or Shemesh March 2010 shemesh72369@gmail.com. Gap junctions. Relatively non-specific. Molecular movement through passive diffusion. Selectivity based upon molecular size (- allow movement of molecules whose molecular weight <1000Da.)


Electrical Synapses
E N D
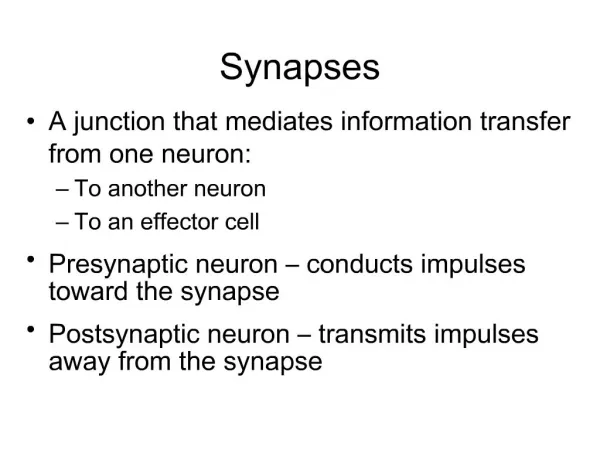
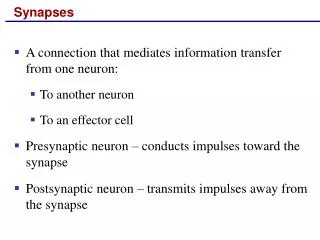
Presentation Transcript
Electrical Synapses Or Shemesh March 2010 shemesh72369@gmail.com
Gap junctions • Relatively non-specific. • Molecular movement through passive diffusion. • Selectivity based upon molecular size • (- allow movement of molecules whose molecular weight <1000Da.) • (- allow movement of molecules whose diameter < 1.2nm.) Cell #2 Cell #1
Structural arrangement of Gap junctions Connexon ( A hemi-channel) Connexin
Structural arrangement of Gap junctions Two docked connexons (a gap junction channel) Gap junction plaque
Cell 1 Cell 2 Two coupled cells in Vitro
The equivalent electrical circuit V1 V2 Cell 1 Cell 2 rc r1 r2 I2 I1
The equivalent electrical circuit V1 V2 Cell 1 Cell 2 rc r1 r2 The equivalent electrical circuit V1 V2 I1 I2
V1 V2 Cell 1 Cell 2 rc r1 r2 Basic concepts V 1 1 Current injected to cell Voltage in cell I1, I2 V11,V22, V21, V12
Cell 1 Cell 2 rc r1 r2 Input resistances
Cell 1 Cell 2 rc r1 r2 Input resistances If rc << r2 and rc << r1 Then
Cell 1 Cell 2 Cell 1 Cell 2 rc rc r1 r2 r1 r2 Transfer resistances
Cell 1 Cell 1 Cell 2 Cell 2 Coupling coefficients Potential in un-injected cell Potential in injected cell
A typical trace I1 V11 V12 I2 V21 V22
Cell 1 Cell 2 0 0.5 1.0 1.5 2.0 Traces! -0.5 nA, injected to cell 2 (left cell). Cell1 Cell2
Cell 1 Cell 2 Traces! -0.5 nA, injected to cell 1 (right cell). Cell1 Cell2
Cell 1 Cell 2 Traces! +0.4 nA, injected to cell 2 (left cell). Cell1 Cell2
Cell 1 Cell 2 Traces! +0.4 nA, injected to cell 2 (left cell). Cell1 summation accommodation Cell2