Download
1 / 19
190 likes | 320 Vues
This study explores the effectiveness of computerized mating programs that integrate genomic relationships and dominance effects to minimize inbreeding in animal breeding. Utilizing dense SNP markers enhances the pinpointing of matings with minimal common ancestors. The research outlines novel strategies, including linear programming, to maximize expected progeny values and suggests developments for integrating dominance effects in genetic evaluations. Findings indicate that genomic-based relationships lead to superior outcomes compared to pedigree-based methods, significantly reducing progeny inbreeding rates.

E N D
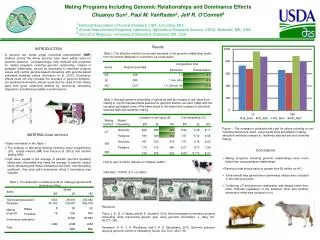
Mating Programs Including Genomic Relationships and Dominance Effects Chuanyu Sun (NAAB) Paul VanRaden (AIPL)
Introduction • Computerized mating programs have helped breeders reduce pedigree inbreeding by identifying matings between animals with fewer ancestors in common than average • In genomic era, dense single nucleotide polymorphism (SNP) markers across the whole genome have been widely used for genomic selection Pedigree relationship Genomic relationship
Introduction • Inbreeding should be controlled on the same basis as used to estimate breeding values (Sonesson et al. 2012) • Pedigree-based inbreeding control with traditional pedigree-based method estimated breeding values • Genome-based inbreeding control with genome-based estimated breeding values • New programs to minimize genomic inbreeding by comparing genotypes of potential mates should be developed and implemented by breed associations, AI organizations, and on-farm software providers
Introduction • Dominance effects could also be included in mating programs to estimate inbreeding losses more precisely • However, dominance effects have been rarely included in genetic evaluations • Computational complexity • Lack of statistical reliability for estimates of variance components • Most countries only genotyped bulls and a few females • Estimation of dominance effects of SNP requires the availability of direct phenotypes (i.e., genotypes and phenotypes for the same individuals)
Introduction Objective • Develop a method of rapid delivery of genomic relationships from central database to the industry • Mating program: • Two kinds of relationship matrix A and G • Three mating strategies for maximizing expected progeny value • linear programming (LP) • sequential selection of least-related mates (Pryce et al., 2012, SM) • random mating (RD) • Extension to include dominance effect
Materials and Methods Numbers of animals used for calculating the genomic relationship matrix and dominance effect and used in mating programs by breed
Materials and Methods • Potential options for providing the genomic relationship matrix required for a genomic mating program include
Materials and Methods • Mean expect progeny values (EPV) GLNM is Genomic lifetime net merit BLNM is defined as the loss of LNM per 1% inbreeding, EFI is expected future inbreeding, Gsire,damis the genomic relationship between sire and dam
Materials and Methods • Linear mixed models were used to estimate additive and dominance variance components: GBLUP • Predict SNP effects: SNP-GBLUP
Materials and Methods • The dominance effect for each progeny was obtained by summing over all loci and the 3 genotype probabilities, giving • Mean EPV for milk yield
Materials and Methods • Mating strategies LP vs SM vs RD Matings were limited to 10 females per bull and 1 bull per female. female Bulls
Results Computation times and disk storage required for the genomic relationship matrix (G) for genotyped cows and marketed bulls and computation times for extraction or recalculation of G for a subset of animals
Results – without dominance • For all methods and groups of bulls, EPV was higher when genomic rather than pedigree relationship was used as the mate inbreeding source. • For each group of bulls, EPV was higher for linear programming than the sequential method, and both of those methods were better than random mating. • When mates were from the top 50 bulls for genomic LNM, EPV was higher than when mates were from the top 50 for traditional LNM or random bulls. • Mean genomic inbreeding of progeny was lowest when genomic relationship was used other than pedigree relationship • LP is better than SM and RD on control inbreeding of progeny
Results – with dominance • Dominance variances were 4.1% and 3.7% of phenotypic variance for Holsteins and Jerseys, respectively.
Results – with dominance • Regardless of bull group, mating method, and inbreeding source, EPV for milk yield of Holsteins and Jerseys was higher when dominance effects were included • Progeny inbreeding can be decreased by using linear programming instead of the sequential method and using genomic rather than pedigree relationships for the mating program with a dominance effect included. • Progeny inbreeding did not decrease by including a dominance effect. A possible reason may be selection for dominance effects diluted the attempt to minimize genomic inbreeding.
Results Inputs HOUSA000069981349 HOUSA000069560690 HOUSA000070625846 HOUSA000064633877 HOUSA000053668601 HOUSA000134954851 HOUSA000061834459 HOUSA000061839286 HOUSA000061845599 HOUSA000061845646 HOUSA000061845655 HOUSA000061845681 HOUSA000061845689 HOUSA000061845706 HOUSA000061845722 HOUSA00035SHE7944 HOUSA00035SHE7943 HOUSA00035SHE7948 HOUSA00035SHE7949 Outputs
Conclusions • Mating programs including genomic relationships were much better than using pedigree relationships • Extra benefit was gained when dominance effects were included in the mating program. • Combining LP and genomic relationship was always better than other methods regardless of the selection done and whether dominance effect was included or not. • A total annual value of ($494 $462)(120,989) = $3,871,648 when applied to 120,989 females genotyped in the last 12 months (ending June 2013) for HO • Developed mating software is ready for service