Advanced Visualization Tools for Adaptive Mesh Refinement in Data Analysis
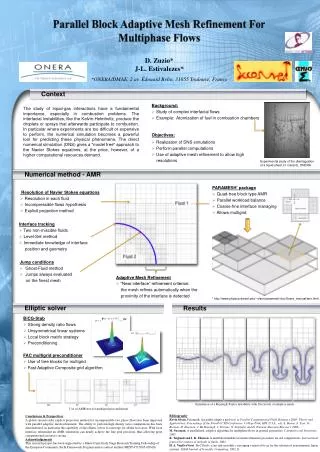
This document presents an in-depth exploration of the current state of visualization tools tailored for Adaptive Mesh Refinement (AMR) data. It emphasizes the Berger-Colella AMR framework and its implications in computational fluid dynamics. Key topics include effective visualization of scalar AMR data, extraction of crack-free isosurfaces, and the use of dual grids to enhance data representation. Furthermore, innovative strategies for stitching gaps between hierarchy levels are discussed, alongside practical results from AMR simulations, providing insights for researchers and practitioners in the field.

Advanced Visualization Tools for Adaptive Mesh Refinement in Data Analysis
E N D
Presentation Transcript
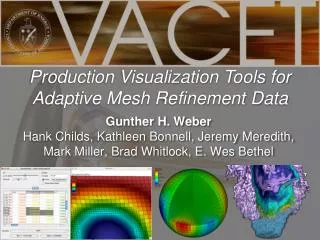
Visualization Tools for Adaptive Mesh Refinement Data Gunther H. Weber1, Vincent E. Beckner1, Hank Childs2, Terry J. Ligocki1, Mark C. Miller2, Brian Van Straalen1 and E. Wes Bethel1 1Lawrence Berkeley National Laboratory2Lawrence Livermore National Laboratory
Outline • Introduction to Berger-Colella AMR • Visualization of Scalar AMR Data • Specialized AMR Visualization Tools • Visualization Tools with AMR Support • Short overview of VisIt Current State of the Art in Adaptive Mesh Refinement Visualization
Adaptive Mesh Refinement • Computational fluid dynamics technique • Topological simplicity of regular grids • Adaptivity of unstructured meshes • Nested rectilinear patches, increasing resolution • Reduce simulation time • Reduce storage space • Berger-Colella AMR: axis-aligned patches • Very often: Cell centered data Current State of the Art in Adaptive Mesh Refinement Visualization
Berger-Colella AMR Format Current State of the Art in Adaptive Mesh Refinement Visualization
Effective Visualization of Scalar AMR Data Isosurfaces • Extraction of continuous “crack-free” isosurfaces Visualization Visualization “Direct Volume Rendering” Hierarchical AMR simulation • Effective utilization of the hierarchy for efficient rendering • Good interpolation functions Aim: Use inherently hierarchical structure for efficient visualization Current State of the Art in Adaptive Mesh Refinement Visualization
AMR Visualization ‒ In the Beginning • Translation of AMR to unstructured meshes [Norman et al. 1999] • Visualization with standard tool (VTK, IDL, AVS) • Ineffective utilization of computational resources • Direct Volume Rendering • Mention AMR data without further details [Max 1993] • PARAMESH [Ma 1999] • Resampling • Block-based Current State of the Art in Adaptive Mesh Refinement Visualization
Marching Cubes and Dangling Nodes • Marching cubes needs vertex centered data • Resample data set to vertex centered case • Dangling nodes := only present in fine level (yellow + red) • Choice of consistent values to avoid problems? • Compare [Westermann, Kobbelt, Ertl 1999] Same in coarse and fine grid No unique value avoids problems Linear interpolation avoids problems Current State of the Art in Adaptive Mesh Refinement Visualization
Previous Crack-fixing Solutions • Mostly in context of Octree-based hierarchies • [Shu et al., 1995]: Create polygon to fit crack • [Shekhar et al., 1996]: Collapse polyline to line • [Westermann et al., 1999]: Create triangle fan [Shekar et al., 1996] [Westermann et al., 1999] Current State of the Art in Adaptive Mesh Refinement Visualization
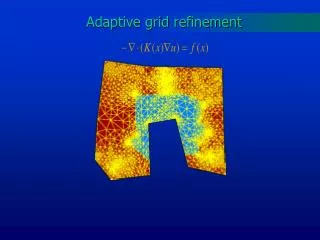
First Approach: Use of Dual Grids • “Avoid interpolation whenever possible!” • Avoid interpolation apart from linear interpolation along edges, which is part of marching cubes • Use dual grid := grid formed by connecting cell centers Current State of the Art in Adaptive Mesh Refinement Visualization
Dual Grid – Original Grid Current State of the Art in Adaptive Mesh Refinement Visualization
Dual Grids Current State of the Art in Adaptive Mesh Refinement Visualization
Advantages of Dual Grid Approach • Use of valuesoriginal data for marching cubes • No dangling nodes • Instead: Gaps between hierarchy levels! • Fill those gaps with stitch cells Current State of the Art in Adaptive Mesh Refinement Visualization
Stitching the Gaps • Tessellation scheme for filling the gap between two hierarchy levels • Constraints • Only gap region is tessellated • The complete gap region is tessellated • Only vertices, edges and complete faces are shared • In 3D space: Cannot use tetrahedra because cells must share quadrilaterals as faces Current State of the Art in Adaptive Mesh Refinement Visualization
Stitching Process Current State of the Art in Adaptive Mesh Refinement Visualization
Fine patch Coarse patch Stitch Cells – 3D Case Cell Faces Cell Edges Cell Vertices Current State of the Art in Adaptive Mesh Refinement Visualization
First Results AMR simulation of star cluster formation Root level 32x32x32 [Data set: Greg Bryan, Theoretical Astronomy Group, MIT] Coarse Patch Stitch Cells Fine Patch Current State of the Art in Adaptive Mesh Refinement Visualization
Multiple Patches • Multiple patches can be connected using the same scheme • However: Special care must be taken with adjacent fine patches. • Must “merge” adjacent grids (i. e., “upgrade” edges to quadrilaterals and vertices to edges) Current State of the Art in Adaptive Mesh Refinement Visualization
Multiple Patches – Example Current State of the Art in Adaptive Mesh Refinement Visualization
Multiple Patches – Example Current State of the Art in Adaptive Mesh Refinement Visualization
Multiple Patches – Example Current State of the Art in Adaptive Mesh Refinement Visualization
Fine patch Coarse patch Multiple Patches – Fine Edge to Coarse Edges All coarse grid points unrefined Two neighboring coarse grid points refined Two diagonally opposed coarse grid points refined All coarse grid points refined Current State of the Art in Adaptive Mesh Refinement Visualization
Isosurface - One Level AMR simulation of star cluster formation Root level 32x32x32 [Data set: Greg Bryan, Theoretical Astronomy Group, MIT] Current State of the Art in Adaptive Mesh Refinement Visualization
Isosurface - Two Levels AMR simulation of star cluster formation First level Stitch cells (1/2) Second level Current State of the Art in Adaptive Mesh Refinement Visualization
Isosurface - Three Levels AMR simulation of star cluster formation First level Stitch cells (1/2) Second level Stitch cells (2/3) Third level Current State of the Art in Adaptive Mesh Refinement Visualization
Second Approach: Keep Grid • Vertex/node centered data • Retain “identity” of cells (debugging) • Subdivide boundary cells into pyramids • Eliminates “non-linear” hanging nodes • Standard isosurface techniques for pyramids Current State of the Art in Adaptive Mesh Refinement Visualization
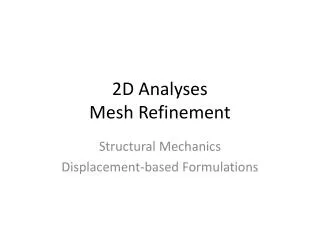
2D Case • Forms basis of 3D case • Split cell faces to eliminate hanging nodes along edges • Obtain values at newly created hanging by linear interpolation Current State of the Art in Adaptive Mesh Refinement Visualization
2D Results Extracted contour Cells due to added samples Current State of the Art in Adaptive Mesh Refinement Visualization
3D Cell Face Subdivision • Subdivide lower-resolution cell face to match higher resolution face • Subdivide cell face to eliminate hanging nodes Current State of the Art in Adaptive Mesh Refinement Visualization
3D Cell Subdivision • Subdivide cell into pyramids with common apex point Current State of the Art in Adaptive Mesh Refinement Visualization
Second Approach – Results Current State of the Art in Adaptive Mesh Refinement Visualization
Second Approach – Results Current State of the Art in Adaptive Mesh Refinement Visualization
Hardware-accelerated Preview of AMR Data • Interactive DVR for choosing view point and transfer function • Subdivide data set in regions of constant resolution • AMR Partition Tree (generalized kD-tree) • Traverse “AMR Partition tree” and render regions using hardware-accelerated DVR Current State of the Art in Adaptive Mesh Refinement Visualization
Homogenization Current State of the Art in Adaptive Mesh Refinement Visualization
Homogenization Current State of the Art in Adaptive Mesh Refinement Visualization
Homogenization Current State of the Art in Adaptive Mesh Refinement Visualization
Homogenization Current State of the Art in Adaptive Mesh Refinement Visualization
PN Partition Tree – Example PN = Partition node along one axis CU = Completely unrefined region CR = Completely refined region = Transition to next level PN PN CU CU CU CR CU CU CR CR CU CU PN PN Current State of the Art in Adaptive Mesh Refinement Visualization
Hardware-accelerated Rendering – Interactive AMR simulation of star cluster formation Root level 32x32x32 [Data set: Greg Bryan, Theoretical Astronomy Group, MIT] Current State of the Art in Adaptive Mesh Refinement Visualization
Hardware-accelerated Rendering – Maximum Quality AMR simulation of star cluster formation Root level 32x32x32 [Data set: Greg Bryan, Theoretical Astronomy Group, MIT] Current State of the Art in Adaptive Mesh Refinement Visualization
High-quality DVR of AMR Data • Use “cell projection” [Ma & Crockett 1997] to display individual patches • Traverse patches and construct ray segments [object space based] • Ma & Crockett: Sort ray segments Current State of the Art in Adaptive Mesh Refinement Visualization
Interpolation • Nearest neighbor (constant) interpolation ➔ debugging • Piecewise Linear Method (PLM) ➔ Discontinuities • Dual grids (trilinear) and stitch cells Bilinear Linear Current State of the Art in Adaptive Mesh Refinement Visualization
Interpolation with Stitch Cells – One Hierarchy Level Simulation of an Argon bubble in a surrounding gas hit by a shockwave [Data set: Center for Computational Sciences and Engineering (CCSE), Lawrence Berkeley National Laboratory] Current State of the Art in Adaptive Mesh Refinement Visualization
Interpolation with Stitch Cells – Two Hierarchy Levels Simulation of an Argon bubble in a surrounding gas hit by a shockwave [Data set: Center for Computational Sciences and Engineering (CCSE), Lawrence Berkeley National Laboratory] Current State of the Art in Adaptive Mesh Refinement Visualization
Interpolation with Stitch Cells – Three Hierarchy Levels Simulation of an Argon bubble in a surrounding gas hit by a shockwave [Data set: Center for Computational Sciences and Engineering (CCSE), Lawrence Berkeley National Laboratory] Current State of the Art in Adaptive Mesh Refinement Visualization
No Transfer Function Scaling AMR simulation of star cluster formation Root level 32x32x32 [Data set: Greg Bryan, Theoretical Astronomy Group, MIT] Current State of the Art in Adaptive Mesh Refinement Visualization
Opacity Scaling AMR simulation of star cluster formation Root level 32x32x32 [Data set: Greg Bryan, Theoretical Astronomy Group, MIT] Current State of the Art in Adaptive Mesh Refinement Visualization
Opacity and Saturation Scaling AMR simulation of star cluster formation Root level 32x32x32 [Data set: Greg Bryan, Theoretical Astronomy Group, MIT] Current State of the Art in Adaptive Mesh Refinement Visualization
Texture-based AMR Volume Rendering • [Kähler & Hege, 2001 / 2002] • Resample to node centered • Subdivide in homogenous resolution regions (kD-tree) • Minimize number of blocks using information about AMR grid placement algorithm • Texture/Slicing-based volume rendering • Optimized texture packing • Adapt slice spacing & correct opacity Current State of the Art in Adaptive Mesh Refinement Visualization