Download
1 / 39
390 likes | 496 Vues
This unit explores the impact of technology on society, focusing on the risks that accompany technological advancements. Delve into principles of risk assessment, statistical techniques, and case studies such as chemicals in the environment. Discover key concepts such as probability, statistics, and different risk categories. Dive into challenging problems that test your understanding of risk analysis and probability theory. Explore how technology has both improved and introduced risks into our lives, sparking debates on risk management and assessment in the fields of science and politics.

E N D
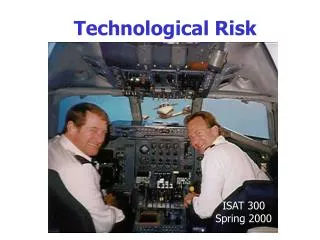
Technological Risk ISAT 300 Spring 2000
Rationale for New Unit • Science and technology have greatly improved our lives. • But they have introduced risks as well • Technology risks vs benefits are being questioned by society at large • Major issue in science and politics today • More and more demand to measure the risks introduced by technology
Bibliography • H.W. Lewis, Technological Risk, WW Norton, 1990 • Charles Perrow, Normal Accidents : Living With High-Risk Technologies, Princeton University Press, 1999 • Wheeler and Ganji, Introduction toEngineering Experimentation,Prentice Hall, 1996” • Probabilistic Risk Assessment and Management for Engineers and Scientists", H. Kumamoto and E. Henley, IEEE Press 1996 • Understanding Risk Analysis (American Chemical Society Website)
Outline • What we mean by “risk” • Categories dictate ease of measurement/ characterization • Measurement / assessment of risk • Statistical techniques- Poisson Distribution- Binomial Distribution • Fault Trees and Probabilistic Risk Assessment • Example Risk Area: Chemicals in the environment • Conclusions
Questions • What is meant by the term “risk?” • What are the 4 major categories of risk? Give examples for each. • What is the difference between probability and statistics? • What is meant by the term “random?” • What statistical distribution treats low probability events with small numbers of occurrences? • What statistical distribution is used when we know the probability something will happen on each try, but want to know the probability that it will happen in a specified number of tries? • What statistical distribution is used when we are measuring something rather than counting it? • What branch of statistics is used to predict results based on prior observed data? • What branch of statistics is used to predict data based on observed prior results and makes use of subjective judgement?
Problems • Assume each face of a die is equally likely to land facing up. Consider a game which involves the tossing of 5 dice. Find the probability that the number “1” appears uppermosta. On exactly one dieb. In at least one diec. In exactly two dice • In Russian roulette (not recommended), one cartridge is loaded leaving the other 5 chambers of a revolver empty. The cylinder is then spun so that the loaded cartridge is at an unknown random position. What is the probability of still being alive after playing the gamea. Once?b. Twice?c. N times? • A number is chosen at random between 0 and 1. What is the probability that exactly 5 of its first 10 decimal places consist of digits less than 5?
Problems, Cont’d • A certain aircraft manufacturing plant averages 5 random defects per aircraft coming off the the assembly line. What is the probability that any given aircraft has zero defects? Ten defects? • A computer is built with 5 large scale integrated circuits (LSICs), each with a known mean time between random failures of 30,000 hours. Each is critical to the operation of the computer. (a) What is the probability that the computer will fail in the first 30 days of operation (warranty period)? (b) What is the probability the computer will fail in the first year? • A poll of 200 people concerning preference for one or the other of 2 candidates for the U.S. Senate shows one candidate in the lead by 10%. Should the poll be trusted to predict the election outcome?
Risk-- What is it? • American Heritage Dictionary definition includes, “The possibility of suffering harm or loss; danger... The danger or probability of loss to an insurer. A factor, thing, element, or course involving uncertain danger.”- Risk combines the idea of loss with that of uncertainty and probability- Since death and taxes are inevitable, they lack the element of chance and hence, risk. (Only efforts to evade the latter are risky.) • Most basic risk is the chance of death before our allotted time- 1789 Massachusetts data indicated life expectancy at birth of 35 years- American born in 1920 expected to live to 54- Today it’s 75 in America, about 60 world-wide (increases due to technical advances applied in public health initiatives)- 40 year increase in 200 years means science and public health has added about 10 weeks to our lives every year…Technology clearly has benefits!!
Four Risk Categories(and associated ease of measurement) • 1. Familiar activities with large sample sizes and serious individual consequences (e.g. traffic fatalities) • 2. Low probability events with large scale consequences with precedents(e.g. Chernobyl type reactor failures) • 3. Low probability events with large scale consequences without precedents (e.g. global nuclear war) • 4. Risks manifest as potential increases in naturally occurring hazards(e.g. disease caused by environmental contaminants) Very Difficult Challenging Straightforward
Category 1: Familiar Risks • Example: In U.S. we have ~1 fatality for average motor vehicle occupant for every 100 million miles of travel on our roads. What is the chance of being killed in driving from Harrisonburg to New York City (about 400 miles)? 400/100 million = 4 x 10⁻⁶. • Could do this by young vs old drivers, male vs female drivers, interstate vs scenic route. • Common risks easy to analyze because there’s lots of data - use “frequentist” approach • Estimates of consequences are more difficult, some consequences involving highly personal questions of value- injury vs death relative compensation?- value of loss due to injury ($1M for coffee burn in Albuquerque?!)- value of individual life? (Ford used $200,000 for Pinto reparations)
Category 2: Low probability, high consequence events w/precedents • Examples: - Natural (earthquakes, floods, tornadoes) referred to as “Acts of God”- Human error (nuclear reactor catastrophes, space program accidents) • Probability of earthquake in Southern California… almost a century since the last “big one.” (last major earthquake was 1906 San Francisco event) • Get our estimates of probability from limited experience and theoretical understanding, neither of which is precise • Try to expand our knowledge via research and development- Understand the limited statistics we have- Develop and improve global predictive models for earthquakes, floods, hurricanes - Develop better engineering and risk assessment models for human systems.
Category 3: Low probability, high consequence events w/o historical precedents • Examples: - Natural: Large asteroid impact on earth- Human: Regional or global nuclear weapon exchange, bio-agent contamination of metropolitan water supply, stock market crash induced by hackers • Virtually no data • Estimates of probability and consequences must be based on theory alone… frequentist and Bayesian approaches apply. - Lots of uncertainty and room for disagreement… need for communication- Technologists must be pro-active to counter claims of demagogues and technical charlatans (show biz personalities and lawyers a particular problem here).
Risk Category 3, cont’d • Research and planning important to:- Determine the probability- Estimate the consequences- Find ways to reduce probability- Find ways to mitigate the consequences • Category suffers from misunderstanding of what is implied by low probability. Small probability doesn’t mean zero probability.- Ascribing zero probability is used as excuse for inaction… for example we should plan for potential consequences of nuclear or chemical attack- Erroneously ascribing 0 probability to certain possible events contributed to Challenger accident according to Rogers Commission- Americans are prone to this • Example of recent proactive program: Critical Infrastructure Protection Program implemented by the National Security Council at the FBI (new National Infrastructure Protection Center or NIPC)
Risk Category 4: Naturally occurring risks that are increased by technology • Examples: Health threats posed by low levels of natural or commercial chemicals, effects of low levels of radiation, global warming • Attention to these sometimes resembles phobia • Know that radiation and certain chemicals in environment can cause cancer… problem is we haven’t determined a magic exposure level below which the offenders are safe and above which they are dangerous. • But we can determine the cancer rate for different exposures.- 22% of us now die from cancer (~400,000 / year from “normal” cancers) so statistically difficult to determine which cancer cases are due to what cause- Recognize that risk can’t be reduced to zero since many of worst offenders are in the natural environment (powerful carcinogen, aflatoxin, is found naturally in peanuts, some experts believe oxygen is a carcinogen)
Measurement of Risk • Combine measure of risk with measure of consequences- Insurance companies use product of probability and value of the loss: R = P ·V- Event w/ probability of one chance in a thousand that would cause a loss of a million dollars gives “expectation of loss” of $1000 as the final measure of risk. - A non-profit insurance company would charge $1000 as a premium • People are not insurance companies- Strong school of thought that larger losses have to be considered disproportionately worse risks- By this reasoning, an event that destroys ten thousand homes would represent a higher risk than one that would destroy a thousand, even if the probability were ten times smaller- This why some companies put executives on separate flights
Assessment of Risk • Essential element of risk is randomness, the fact we don’t know exactly when and where damage will occur (non probabilistic ways to incur harm, like jumping off a skyscraper, are not risk) • Idea of randomness is important in mathematics but lacks a precise definition. Webster’s dictionary uses the word “random” four times in its own definition. “Randomness” is characterized by the absence of a pattern. • For random events, or experimental trials, we find that the uncontrollable fluctuations in the number of times the event occurs are approximately equal to the square root of the expected number, . Statisticians call this the “standard deviation. • We will call this the “ rule ”, consistent with Lewis (ref 1).
N Rule Example • Problem: Two towns, A and B are similar in population, but B is downwind of a large factory. Over the last 10 years, it is noted that 100 babies born in A have birth defects while 110 babies born in B have birth defects. • Question: Should the factory be closed? • Answer using the simple N rule: No since the square root of 100 and 110 are very nearly equal (we expect random fluctuations of a standard deviation which is ~ ±10). If B had 150 cases (5 standard deviations), we should be concerned. • Answer, using more a rigorous approach: see next chart
Incidence of Birth Defects obeys the Poisson Distribution If an event has a small probability, P 1 and we’re interested in cases where the number of occurrences is much less than the total population (occurrences n <<Pop.), then the probability of any number n occurences is: Where N is the mean expected value = 100 in this case. The standard deviation, for this distribution is just =
Question: In general, using the N rule, how big does the number of occurrences have to be to get a standard deviation of 1% or less? Answer: Many risks don’t provide such large numbers of occurrences to give use really tight statistics (e.g. cancers blamed on exposure to radiation or chemical carcinogens) Aside: also means shouldn’t trust close (1% margin) poll results unless have >10,000 random participants.
Another example: Use of Poisson Distribution to determine emergency services needed (Note: Emergency service is a major component of risk management.) Problem: A certain city has an average of 100,000 emergency calls every year. How many operators are needed if each call keeps one operator busy for 30 minutes and we don’t want any operator to be handling more than one call at a time? Solution: Ensure a low probability of more than one call per operator in any time period. 1. First find how many calls to expect in any given 30 minute period. 1 year is 3.16 x 10⁷ sec, so dividing by 100,000 we get 1 call every 316 seconds or about 1 call every 5 minutes or about 6 calls every 30 minutes. 2. Using the Poisson distribution we can compute the probability that we’ll get more than 6 calls every 30 min. 3. From this probability curve and its standard deviation we can decide on a number of operators that will give a sufficiently low probability that each will have to handle more than one call.
= So we may want to have 6 + = 8 or 9 or 6 + 2 = 11operators on hand at any given moment to ensure a low probability that operators will have to be handling more than 1 call at a time.
Binomial Distribution The Poisson distribution applies to cases where we have low probability events from large sample sizes. In cases where we are dealing with relatively small (countable) populations or samples we use the binomial distribution. Applies in coin tossing, dice rolling. Used extensively in risk assessment and quality control. This distribution provides the probability of finding exactly r successes or failures in a total number of n identical samples and is given by: . If we toss 10 coins at once we can find the probability that we see any combination of exactly five heads in 10 coins knowing that probability of heads for any one coin is .5:
We can plot the probability of any combination of heads for 10 coins: For binomial distribution, mean = Total number of trials, NT times the probability of heads per trial: Nmean = NT ·p = (10)(.5) =5 in this case For binomial distribution, (Similar to Poisson distrib.) Note for small p’s,
Binomial Distribution Example Problem: It will take me 10 hours to drive from Harrisonburg to Dayton, Ohio. I have 4 tires and one spare. What’s the probability that I’ll have any combination of 2 tires fail such that I would be totally stranded? I haven’t checked the condition of my tires but I know they have a mean time between failure (MTBF) of 10,000 driving hours so the probability of failure of any one tire will be 10hrs/10,000hrs=.001. Solution: Using the binomial distribution: So having a spare takes me from a .001 risk of being stranded (1 in a thousand) to a .000006 risk (6 in a million). Based on these statistics, a spare is definitely worth having.
Another Binomial Distribution Example • Problem: Our favorite batter has a lifetime .300 average. In his last 50 at-bats he’s only hit .200 (10 hits). Question:Is this cause for concern? • Solution (two ways shown)1. Estimate: apply Lewis’ rule to the mean expected number, N:N=15, 4. So we expect he’d have 15 hits ±4. So 10 hits is a deviation of 5 hits on the low side. Means he’s probably in a slump… he’s slightly outside the expected uncertainty range of one standard deviation.2. Rigorous: Use the binomial distribution. Know standard deviation So we’d expect 15 hits ±3.24. By this statistic, he’s even more likely to be in a slump.
Combining Uncertainties in Risk Analysis Consider a case where I have a system to get data from point A to point B. Furthermore, I want the message to pass through 4 Data Centers (DCs). There are two possible ways of building this system. DC1 PF1 Parallel “OR” Combination DC2 System 1: B A PF2 DC3 PF3 DC4 PF4 In this case, the message gets through if any one of the DCs is operating, i.e. that DC1 or DC2 or DC3 or DC4 works. The overall probability of complete system failure for “OR” combinations is just the product of the individual independent component PF ‘s: System PF = PF1· PF2· PF3· PF4. In the case where PF1= PF2= PF3= PF4=.1, the overall system failure probability is .0001.
Getting Message From A B Series “AND” combination A B System 2: DC1 DC2 DC3 DC4 PF1 PF2 PF3 PF4 In this case, the message gets through only if all the DCs are working, i.e. if DC1 and DC2 and DC3 and DC4 are working. In this case, we note that the probability of a successful message transfer is just PS = (1 - PF1)(1- PF2)(1- PF3)(1- PF4). Then the probability of failure for the system is just PF = 1 - PS . For the case where PF1= PF2= PF3= PF4=.1, the AND combination system risk failure is found to be Pf = 1-PS = 1 - (1 -.1) (1 -.1) (1 -.1) (1 -.1) = 1 - (.9)4 = .344. This is very high compared to the OR combination Pf of .0001. Better to have redundant systems.
The OR and AND combinations just considered are examples of simple “Fault Trees” and are designated by OR PF1 PF2 System Failure Probability Subsystem Failure Probabilities PF3 DC1 PF1 PF4 DC2 B A PF2 DC3 PF3 PF1 DC4 AND PF4 PF2 Subsystem Failure Probabilities System Failure Probability PF3 PF4 A B DC1 DC2 DC3 DC4 PF1 PF2 PF3 PF4
Fault Trees are used in “Probabilistic Risk Assessment” (PRA) models. Example: Fault Tree for Loss of Electric Power to Critical Safety Subsystems in a Nuclear Reactor OR Loss of Municipal Power AND Would have to lose both municipal power and on-site generator to lose AC power to site Loss of on-site generator Loss of AC power to critical safety subsystems Loss of electric power to critical safety subsystems Loss of DC power Loss of either AC or DC power would shut down safety subsystems
Chemical Carcinogenesis • 22 % of all deaths in U.S. are from cancer • Fear of cancer dominates public concern about chemical risk • Of 65,000 chemicals in commercial use, about 150 are known to definitely cause cancer in humans (asbestos, PVC, PCBs…):Carcinogenesis by exposure to chemicals in an exception, not a rule • Dealing with small numbers and small risks so rule important. Otherwise can easily to led to erroneous conclusions in either direction. • Exposure management is to avoid chemicals that have a lifetime chance of not much more than 1 in a million to lethal cancer in an individual • Dealing with such small numbers that the statistics are particularly bad and the natural cancer mortality is far higher
Cancer Risk Testing • To detect a chance of one in a million requires a million tests or there will be no effects (on average) to observe. Prohibitive.- If depended on rat experiments we would soon deplete the world rodent population - So we breed susceptible animal species and give them super-physiological doses to make something happen • When a chemical is nominated for carcinogenicity testing, process begins with “Ames Test”.- Not a cancer test per se- Tests chemicals ability to cause mutations in bacteria- Carcinogens usually cause mutations- If positive, move to animal tests • Sample size- typically 500 mice divided into four dosage groups - dosage groups divided in two, by sex- so typically 500/8 = 60 animals per group
Uncertainties • Vast extrapolations are required to interpret the data in terms of possible risks to humans.- Without knowing exact causes of cancer, rely on “expert judgment- Scale dosage by animal body weight: 1 gram fed to mouse equates to five pounds fed to a person- Many physiological differences between rodents and people- To get cancer must use extremely large doses • Uncertainties are large- Factor of ten uncertainties are common- Dose-effect relationship is very uncertain due to differences in size, physiology, and dose
Mathematical Models • Main objective is to describe the relationship between exposure levels to a substance and the likelihood of getting cancer from it • Both theoretical (based on process understanding) and empirical models (where process is not understood but have some trendline data) are used • Models include:- Linear model: twice the dosage leads to twice the risk, etc.- Quadratic model: twice the dose leads to four times the risk- National Academy model is combination of linear and quadratic- Other more complicated models • Example: National Center for Toxicological Research used 24,000 female mice to test dose response relationship of 2 acetylamino- fluorine. Results indicated linear dose/ incidence relationship for liver tumors, but nonlinear for bladder tumors
Example: Formaldehyde Inhalation Risk Testing • Pioneering test involved 500 mice and 500 rats divided into five exposure groups- First group (control group) received no exposure • Animals exposed to formaldehyde for 2 years (their lifetime) • Result was that - Only 2 mice in the highest exposure group developed cancer- 2 rats in the 4th highest exposure group developed cancer and most of the highest • What to make of it?- Highest exposure is far above any we really care about- Exposures of real interest lie between zero exposure and lowest exposure group. No cancers observed in mice or rats at this level- since about 500 animals had no cancer, we might conclude that formaldehyde is harmless- However, Consumer Products Safety Commission classified formaldehyde as a “probable human carcinogen” based on this test. Note, no mention of dosage.
Delaney Clause • Sets a limit of zero for amount of any covered additive that has shown evidence of causing cancer in man or animals at any dosage • “No additive will be deemed safe if it is found, after tests which are appropriate for the evaluation of the safety of food additives, to induce cancer in man or animal.” • Two dyes, Orange 17 and Red 19 were tested and shown to pose a lifetime risk of one in nineteen billion… means that one American may die in the next ten thousand years. FDA argued argued that this was equivalent to no risk but was turned down by the U.S. Court of Appeals.
Example: Saccharin • Discovered in 1879 at Johns Hopkins University. 400 X sweetness of sugar. • 1970s experiments showed saccharin produces bladder cancer in mice • In 1977 Congress act waived the Delaney clause for saccharin. • Cancer in mice begins in groups that consume equivalent to human consumption of 1/4 pound per day. Equivalent to 100 pounds of sugar per day. We consume about 1/2 ounce of saccharin per person per year. • Using linear model, there is a lifetime risk of at most 10 chances in a million of getting cancer from saccharin • Still an Issue. Resolution tends away from science to legal arguments.- Every year about 2 million Americans die, 440,000 of them from cancer. Statistically, 20 people of this population might be saccharin related.- How much risk is acceptable? Goes beyond science to values. And low probabilities aren’t meaningful if you’re the statistic.- Helpful to look at comparative risks. Risk of pancreatic cancer from coffee is comparable to risk of bladder cancer from saccharin. Think we should ban coffee?
Conclusions • Many different sources of technological risk • They are all comparatively small and pose almost imperceptible threats to most of us… vast majority of us are doomed to expire of far more mundane causes than strange chemicals or radiation • Vehicular travel is the largest single source of technological risk and only responsible for one death forty in the U.S. • But there are non-zero risks and some important “risks-in-waiting” such as global warming, cyber warfare. • Technologies with risk also have considerable benefits- Health, transportation, energy, agriculture.- Technology has dramatic effect on our longevity, standard of living
Conclusions concluded • Risk/ benefit tradeoffs not easy- Risks/ benefits often require value judgments.- But responsible assessment requires some quantitative treatment- Need to determine just how dangerous certain substances are, just how likely certain accidents are- Risk comparisons are helpful • As much as we’d like to, it’s impossible to eliminate risk entirely from our livesa. Need to admit that some bad things will happen without an evil force or malicious intent behind themb. But also need to recognize the risks that we can do something about... and act.- The trick is to tell the difference between a and b, and here’s where measurement coupled with the use of probability and statistics are indispensable.