Download
1 / 57
590 likes | 1.16k Vues
Electrocardiography Dr. Shafali Singh . Electrocardiography. Objective: To define ECG Genesis of ECG Identify different waves of ECG with their causes. Introduction.

E N D
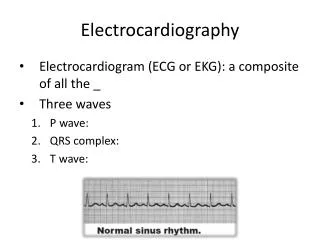
Electrocardiography Objective: • To define ECG • Genesis of ECG • Identify different waves of ECG with their causes
Introduction Electrocardiography is the method of recording an Electrocardiogram (ECG) with the help of the machine Electrocardiograph.
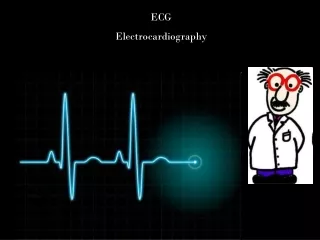
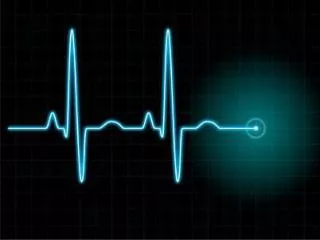
Definition Electrocardiogram (ECG) is a graphic recording of the electrical changes that occur within the heart during the cardiac cycle.
Characteristics of SA Nodal Cells SA Nodal (Pacemaker) Action Potential
Conduction Pathways and Velocity of Conduction Pathway • SA node → atrial muscle → AV node (delay) → Purkinje fibers → ventricular muscle Velocity • Fastest conducting fiber = Purkinje cell • Slowest conducting fiber = AV node
Which of the following has the fastest conducting fibers in the heart? • SA node • Atrial muscle • AV node • Purkinje fibers • Ventricular muscle
Principle Electrical activities generated with each heart beat are conducted from the heart to the body surface, which are picked up and recorded by the electrocardiograph.
The muscle mass of the atria is small compared with that of the ventricles, and the electrical change accompanying the contraction of the atria is therefore small. Contraction of atria is associated with the ECG wave called ‘P’. • The ventricular mass is large and so there is a large deflection of the ECG wave when ventricle is depolarised. This is called the ‘QRS’ complex. • The ‘T’ wave of ECG is associated with the return of ventricular mass to its resting electrical state – ‘repolarization’.
P wave • Cause: atrial depolarization • Configuration: upright and round • Abnormalities: Absent- SA nodal block, A.Fibrillation and hyperkalemia Wide and notched- Left atrial enlargement Tall and peaked- Right atrial enlargement (inTricuspidStenosis)
QRS complex • Q – Septal depolarization • R – Depolarisation of ant part of ventricle • S – Depolarisation of base of ventricle Abnormalities: Deep Q wave – sign of Myocardial ischemia Tall R wave – ventricular hypertrophy Low voltage QRS complex – hypothyroidism, pericardial effusion Wide bizarre QRS complex – ventricular fibrillation
T wave • Cause- repolarization of ventricles • Configuration- upright and rounded • Abnormalities; Inverted T wave- Myocardial ischemia young children Tall and peaked- Myocardial infarction, hyperkalemia
U Wave • Small rounded, upright wave following T wave; • Due to slow repolarisation of papillary muscles • Prominent in hypokalemia
Intervals • PR Interval - Distance between beginning of P wave and beginningof QRS complex; • Measures time during which a depolarization wave travels from the atria to the ventricles; • It measures the AV conduction time including AV conduction delay • Normal: 0.12–0.20 sec • Abnormalities; Incr PR – AV conduction block, ischemic heart disease, rheumatic fever Dec PR – AV nodal rhythm, WPW syndrome
Intervals • QT Interval - Measured from beginning of QRS to end of T wave; • Represents total ventricular activity.(entire duration of depolarization and repolarization of the ventricular muscles) • Normal: less than or equal to 0.4 sec
ST Segment – It is an isoelectric period between the end of QRS complex and beginning of T wave. • Measures time between complete ventricular depolarization and beginning of repolarization • Abnormalities – • Depressed in acute myocardial ischemia • Elevated in myocardial infarction
Recording an ECG • The electrical signal from the heart is detected at the surface of the body through electrodes attached to the surface. • As a result of the sequence and the timing of the spread of depolarization and repolarization in the myocardium, potential differences are established between different portions of the heart, which can be detected by electrodes placed on the body surface • The ECG recorder compares the electrical activity detected in different electrodes and the electrical picture so obtained is called a ‘lead’.
Requirements • ECG machine • Cardiac jelly – to establish proper contact of the electrode plates to the body • ECG paper • ECG leads
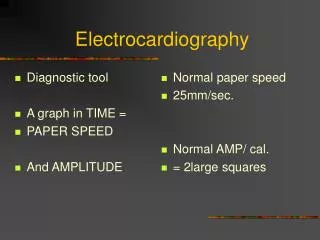
ECG PAPER • Heat sensitive plastic coated paper • Has vertical (amplitude) & horizontal (time) lines 1mm apart • Heavy line every 5mm in both planes • Conventional speed – 25mm/sec (5 big squares) • Small square = 0.04sec • Big square = 0.20sec • Sensitivity – Voltage is measured along vertical axis • 1mV = 10mm (2 big squares)
ECG leads • Direct leads • Indirect leads • Limb leads – Unipolar & Bipolar (record electrical potentials transmitted onto the frontal plane) • Chest leads – Unipolar (record electrical potentials transmitted onto the transverse plane) • Esophageal leads
The 12 lead ECG • Has 6 limb leads and 6 chest leads Limb Leads • Electrodes are placed on the right arm (RA), left arm (LA), right leg (RL), and left leg (LL). With only four electrodes, six leads are viewed. ■ Standard leads: I, II, III ■ Augmented leads: aVR, aVL, aVF
BIPOLAR LIMB LEADS • Einthoven’s leads to record electrical potential on the frontal plane • Two similar electrodes are placed on the body surface & the potential difference between them are recorded
BIPOLAR LIMB LEADS • Lead I – Between the right arm (-) & the left arm (+) • Lead II - Between the right arm (-) & the left leg (+) • Lead III - Between the left arm (-) & the left leg (+) • Right leg acts as ground wire to prevent external disturbance
AUGMENTED UNIPOLAR LIMB LEADS • One limb is the active electrode & the other 2 electrodes are connected to zero potential through 5000 ohms resistance(indifferent electrode) • aVR- RIGHT ARM ACTIVE • aVL- LEFT ARM ACTIVE • aVF- LEFT FOOT ACTIVE
UNIPOLAR CHEST LEADS • Exploring electrode on the chest V1 – V6 • Reference electrode is connected to the right arm, left arm & the left leg through a high resistance – Wilson’s terminal • Right leg – grounding electrode
PROCEDURE • Make the subject to lie down on a couch comfortably • Clean the skin over both wrists & both legs above the ankle joint & apply jelly • Connect the leads in these positions • Switch on the machine & place the stylus at the centre of the paper • Adjust the sensitivity to get a standard calibration • Adjust the lead selector in order – I, II, III, aVR, aVL, aVF & record • Place the chest electrodes V1 – V6 & record