Download
1 / 48
480 likes | 566 Vues
Racial and Partisan Issues in Voting and Redistricting. David Epstein L6172: Law and Social Science March 27, 2006. Let’s Start at the Very Beginning…. Central result in analytical political science is Arrow’s Theorem

E N D
Racial and Partisan Issues in Voting and Redistricting David Epstein L6172: Law and Social Science March 27, 2006
Let’s Start at the Very Beginning… • Central result in analytical political science is Arrow’s Theorem • No method of aggregating preferences satisfies five seemingly innocuous conditions • Contrast with First and Second Welfare Theorems in economics • Implications: • Rules aren’t neutral • There’s no one best way to hold elections
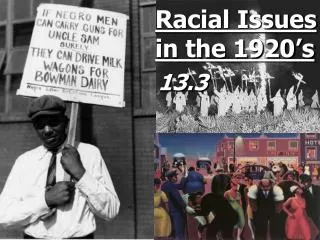
Issue: Voting and Representation • So voting systems can have a significant effect on outcomes • Any particular group can be over- or under-represented, depending on the particular scheme • This is what the South did to prevent Blacks from voting post-Reconstruction • Grandfather clause • White-only primary • At-large elections • Full-ballot provisions/slates, etc.
1965 Voting Rights Act Primer • States would switch to a new tactic if their current method of disenfranchisement was ruled unconstitutional • Literacy tests • Poll taxes • This led to the 1965 Voting Rights Act (VRA) • Section 2 • Swept away all states laws imposing “tests or devices” on any individual’s right to vote • Made illegal all state & local laws that “deny or abridge” minorities’ right to vote • Permanent and (relatively) uncontroversial
1965 Voting Rights Act Primer • Section 5 • Covered states must receive federal approval for changes in laws that may affect voting • Changes in Electoral Systems (but not legislative rules) • Annexation/De-annexation of suburbs • Redistricting • Not permanent; up for renewal in 2007 • Implementation • Standard for preclearance was retrogression • I.e., couldn’t go back to at-large elections • Unclear how this applies to redistricting • Assumption was that you would pass if you didn’t reduce the number of majority-minority districts
Early Successes of the VRA • Most immediate impact was to allow blacks to register and vote in the South • Black registration was ~5% in Mississippi before the VRA • Now White and Black voters register and vote in the same proportion • Under Section 2, many at-large systems were replaced with districts • Then Court said that discrimination had to be intentional (Mobile v. Bolden, 1980) • Congress responded with a results test in 1982 extension
Thornburg v. Gingles • New Section 2 results clause was implemented in a three-prong test: • Minority community is cohesive; • Majority votes sufficiently as a bloc to usually defeat the minority’s preferred candidate; and • The minority is large enough to form a majority in at least one single-member district. • Needed to measure how many voters of one race vote for candidates of the other race.
Ecological Regression • Do this by using ecological regression • Calculate votes for black and white candidates as a percent of total turnout • Run two regressions: • %Votes(Black Cand.) = a + b*(%Black Voters) • %Votes(White Cand.) = a + b*(%Black Voters) • Then calculate • Black Support Black Candidate • Black Support White Candidate • Black Rolloff • And the same for white voters
Ecological Fallacy • First issue: allow covariates? • No, since we don’t care why voters of one race cast their ballots in a particular way. • Second issue: ecological fallacy • Don’t know if the trend is due to changes in voter behavior, or different types of voters • E.g., white who live near blacks may vote differently from those in surrounding areas • No way to separate these two with aggregate level data • Current situation: use better and better statistical techniques to do the best you can with your data (EI)
Representation and the VRA • A central debate on the VRA over the past 10-15 years has centered on the tension between • Descriptive Representation: A minority group can elect its candidates of choice to office; and • Substantive Representation: Policies favored by the minority community are passed into law. • Is there a tradeoff between these goals? • If so, which should states be forced/allowed to pursue, e.g., when redistricting?
Georgia v. Ashcroft • These issues are becoming even more acute now, in light of the most important Supreme Court decision on the VRA in recent years. • Georgia had reduced black populations in concentrated minority districts. • DOJ refused Section 5 preclearance, arguing that the districting plan was retrogressive. • Supreme Court overruled, said that states could legitimately pursue substantive representation. • Opens the door to more of this type of tradeoff.
The Coming Debate • Congress is soon going to have to consider exactly these issues, as it decides what to do with Ashcroft in a renewed Section 5. • These issues are important not just with respect to the VRA and its renewal. • How do we think about the goals and purposes of political representation in democracies? • How can institutions best afford minorities influence over policy in a majoritarian system?
Pre-Ashcroft Preclearance • Based on number of minority(-supported) candidates elected to office. • This, in turn, was measured by the number of districts effectively controlled by minorities. • Used to be “65% rule” • Then changed to majority-minority • In the 1990’s, the DOJ forced southern states to create more majority-minority districts. • Often bizarrely shaped…
Louisiana 4th (Black majority) “Mark of Zorro”
New York 12th (Hispanic Maj.) “Bullwinkle”
Illinois 4th (Hispanic majority) “Pair of Earmuffs”
Georgia 11th (Black majority) “French Poodle Attacking with a Hatchet”
Retrogression and Polarization • The counting-districts approach to assessing retrogression works best when districts are either minority-controlled or not. • Districting becomes a “black-and-white” issue • This implicitly assumes high degrees of polarization in the electorate. • When polarization decreases, this approach breaks down. (Pildes 2002)
Measuring Descriptive Representation P* High Polarization % BVAP 0 50 100
Measuring Descriptive Representation P* High Polarization % BVAP 0 50 100 Minority Control No Minority Control
Measuring Descriptive Representation P* High Polarization % BVAP 0 50 100 Minority Control No Minority Control P* Low Polarization % BVAP 0 50 100
Measuring Descriptive Representation P* High Polarization % BVAP 0 50 100 Minority Control No Minority Control P* Low Polarization % BVAP 0 50 100 Coali- tional
Measuring Descriptive Representation P* High Polarization % BVAP 0 50 100 Minority Control No Minority Control P* PS Low Polarization % BVAP 0 50 100 Coali- tional Probable Control
Measuring Descriptive Representation P* High Polarization % BVAP 0 50 100 Minority Control No Minority Control P* PS PP Low Polarization % BVAP 0 50 100 Coali- tional Probable Control Safe Control Packing
Measuring Descriptive Representation P* High Polarization % BVAP 0 50 100 Minority Control No Minority Control PI P* PS PP Low Polarization % BVAP 0 50 100 Coali- tional Probable Control Safe Control Packing No Minority Control Influence
Measuring Descriptive Representation P* High Polarization % BVAP 0 50 100 Minority Control No Minority Control PI P* PS PP Low Polarization % BVAP 0 50 100 Coali- tional Probable Control Safe Control Packing No Minority Control Influence How to make tradeoffs?
Need for New Standards • Current situation is characterized by low(er) polarization over the past 30 years. • Now 15-20% net crossover in the South. • Need a standard for retrogression in descriptive representation not based on district categories. • State may show that “gains in the plan as a whole offset the loss in a particular district.” • Also evidence of an emerging tradeoff between substantive and descriptive representation. • Ashcroft addresses this directly for the first time.
Ashcroft & Substantive Representation Descriptive Pareto Frontier Substantive
Ashcroft & Substantive Representation Descriptive Pareto Frontier SQ Substantive
1 2 3 4 Ashcroft & Substantive Representation Descriptive Pareto Frontier SQ Substantive
1 2 3 4 Ashcroft & Substantive Representation Descriptive Pareto Frontier SQ X X Substantive Pre-Ashcroft
1 2 3 4 Ashcroft & Substantive Representation Descriptive Pareto Frontier SQ X Substantive Post-Ashcroft
1 2 3 4 Ashcroft & Substantive Representation Descriptive Pareto Frontier SQ X P Substantive A move to P is now non-retrogressive, if supported by minority community.
Measuring Representation • Ashcroft thus calls for • A new measure of descriptive representation based on a statewide assessment of electoral possibilities • A consistent measure of substantive representation that can be used to prospectively evaluate districting plans • Social science has well-developed methods to address both of these issues • Calculating the probability of electing different types of representatives, based on district characteristics • Summarizing voting behavior in legislatures • These are continuous measures, avoiding the categorization problem
1. Determine relationship BVAP Roll Call Voting in Congress (Representation Effect) • 2. Determine relationship BVAP Type of Representative Elected (Electoral Effect) • 3. Combine 1 & 2 to calculate average expected Vote Score across districts. Representation Equation Electoral Equation Methodology • To measure expected substantive representation:
Electoral Equations • Collect outcomes for all relevant elections • Estimate BVAPType Elected • Republican • White Democrat • Black Democrat (“Candidate of Choice”) • This yields the probability that each type of representative is elected, given district BVAP
42.2% 65.4% Southern Congressional Districts
Representation Equations • Collect all individual votes in the legislature. • For each vote, determine which way the majority of minority representatives cast their ballots • Count this as a vote in the “right” direction • For each legislator, calculate the percent of times they voted with the black majority • This is their “Black Support Score” • Can weight by degree of unanimity among black reps. • For each subgroup, estimate BVAPSupport Score
Georgia’s Gerrymander Plan: Reallocate black voters to elect Democrats
Descriptive Representation Slight fewer candidates of choice elected.
Substantive Representation Increase in mean and median vote scores.