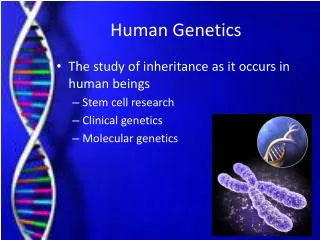
Human Genetics
Human Genetics. Genetic Epidemiology. Family trees can have a lot of nuts. Genetic Epidemiology - Aims. Gene detection Gene characterization. mode of inheritance allele frequencies → prevalence, attributable risk. Genetic Epidemiology - Methods. Aggregation Segregation


Human Genetics
E N D
Presentation Transcript
Human Genetics Genetic Epidemiology
Genetic Epidemiology - Aims • Gene detection • Gene characterization mode of inheritance allele frequencies → prevalence, attributable risk
Genetic Epidemiology - Methods • Aggregation • Segregation • Co-segregation • Association
affected and unaffected or two distributions: Also possible: three distributions: Segregation Can the dichotomy or trichotomy be explained by Mendelian segregation? determined by a dominant or recessive allele
The joint probability of the genotypes and phenotypes of all the members of a pedigree can be written as Likelihood (parameter(s); data) Probability (data | parameter(s))
P(AA transmits A) = τ AA A P(Aa transmits A) = τ Aa A P(aa transmits A) = τ aa A Transmission Probabilities Value if there is Mendelian segregation 1 ½ 0
Ascertainment • We examine segregating sibships • The proportion of sibs affected is larger than expected on the basis of Mendelian inheritance • The likelihood must be conditional on the mode of ascertainment • We need to know the proband sampling frame
ultimate statistical proof of genetic etiology Cosegregation • Chromosome segments are transmitted • Cosegregation is caused by linked loci
(parametric) (non-parametric) Methods of Linkage Analysis • Trait model-based – assume a genetic model underlying the trait • Trait model-free - no assumptions about the genetic model underlying the trait • Ascertainment is often not an issue for locus detection by linkage analysis
Model-based Linkage Analysis • If founder marker genotypes are known or can be inferred exactly, • → no increase in Type 1 error • → smallest Type 2 error when the model is correct • If founder marker genotypes are unknown, we can • 1) estimate them • 2) use a database • All parameters other than the recombination fraction are assumed known
A1A1 A1A2 A1A2 A1A2 IBD Model-free Linkage AnalysisIdentity-in-state versus Identity-by-descent Two alleles are identical by descent if they are copies of the same parental allele
Sib pairs share 0, 1 or 2 alleles identical by descent at a marker locus 0, 1 or 2 alleles identical by descent at a trait locus Linkage The average proportion shared at any particular locus is 1/2
Relative Pair Model-Free Linkage Analysis • We correlate relative-pair similarity (dissimilarity) for the trait of interest with relative-pair similarity (dissimilarity) for a marker • Linkage between a trait locus and a marker locus • → positive correlation • Affected relative pair analysis: Do affected relative pairs share more marker alleles than expected if there is no linkage? • No controls!
Association • Causes of association between a marker and a disease • chance • stratification, population heterogeneity • very close linkage • pleiotropy
Simpson's paradox: If we mix two populations that have both different disease prevalence and different marker allele prevalence, and there is no association between the disease and marker allele in each population, there will be an association between the disease and the marker allele in the mixed population. This allelic association is nuisance association Causes of Allelic Association Heterogeneity/stratification The best solution to avoid this confounding is to study only ethnically homogeneous populations
Imagine a number of generations ago, a normal allele d mutated to a disease allele D on a particular chromosome on which the allele at a marker locus was A1 mutation A1 d A1 D (Tight)Linkage This chromosome is passed down through the generations, and now there are many copies. If the distance between D and A1 is small, recombinations are unlikely, so most D chromosomes carry A1 This is the type of allelic association we are interested in
Guarding Against Stratification • Three solutions: • use a homogenous population • use family-based controls • use genomic control
Siblings Cousins Matching on Ethnicity • Close relatives are the best controls, but can lead to overmatching • Cases and control family members must have the same family history of disease
A1A2 A2A2 A1A2 Transmission Disequilibrium Test (TDT) • A design that uses pseudosibs as controls • Cases and their parents are typed for markers Transmitted genotype is A1A2 Untransmitted genotype is A2A2 Father transmits A1, does not transmit A2 Mother transmits A2, does not transmit A2 (uninformative in terms of alleles)
Transmitted A1 A2 A1 A2 Untransmitted • Transmitted A1 A2 A1 A2 a b Untransmitted d c (b - c)2 b + c • McNemar's test : χ12 • Build up a 2 x 2 table: • The counts a and d come from homozygous parents • The counts b and c come from heterozygous parents
Genomic Control • Calculate an association statistic for a candidate locus • Calculate the same association statistic, from the same sample, for a set of unlinked loci • Determine significance by reference to the results for the unlinked loci
Linkage Between a Marker and a Disease • Intrafamilial association • Typically no population association • Not affected by population stratification • Population association if very close
Allelic Association Linkage Association versus Linkage • Association at the population level Intrafamilial association • Pinpoints alleles Pinpoints loci • More powerful Less powerful • More tests required Fewer tests required • More sensitive to mistyping Less sensitive to mistyping • Sensitive to population stratification Not sensitive to population stratification • Which is better?
If heterogeneity / stratification could be an issue, genome scan desired, What is the Best Design and Analysis? • If heterogeneity / stratification is a non-issue, • unrelated cases and controls for association analysis • (genome scan?) • large extended pedigrees, type all (founders and non- founders) for 200-400 equi-spaced markers, for linkage analysis Note: cost, burden of multiple testing A wise investigator, like a wise investor, would hedge bets with a judicious mix
Consider a particular marker allele, A1, sample of cases and controls: Number of A1 alleles 0 1 2 Total Cases r0 r1 r2 R Controls s0 s1 s2 S Total n0 n1 n2 N Case-Control Data
Number of A1 Alleles 0 1 2 Cases p0 p1 p2 Controls q0 q1 q2 • Consider the probability structure: • Cochran-Armitage trend: test the null hypothesis • p2 + ½p1 = q2 + ½q1 • without assuming the two alleles a person has are independent Sasieni (1997) Biometrics 53:1253-1261
genomic control. Devlin and Roeder (1999) Biometrics 55:997-1004 Cochran-Armitage Trend Test • Does not assume independence of alleles within a person • Does assume independence of genotypes from person to person • Is not valid if there is population stratification • The increased variance due to stratification can be estimated from a random set of markers that are independent of the disease
Look at departure from A1A1 A1A* A*A* p2 2p(1-p) (1-p)2 where p = P(A1) = p2 + ½p1 • Hardy-Weinberg Disequilibrium (HWD) test statistic: Case-only Studies • Suggested as • more powerful (only cases needed) • more precise (signal decreases faster with distance from the causative locus)
therefore we consider this HWD trend test: Case - only Studies • No power in the case of a multiplicative model • No controls • there must be a difference in HWD between cases and controls
We want to give more weight to b or d, whichever yields the larger signal Therefore take Weighted average of the Cochran-Armitage trend test and the HWD trend test statistics
To investigate the null distribution of this average we simulate many different situations – sample sizes up to 10,000 cases and 10,000 controls - and generate • For all situations considered, the distribution is well approximated by a Gamma distribution
As the sample size and marker allele frequency increase, the largest mean and the smallest variance occur for 10,000 cases and 10,000 controls, and for a marker allele frequency 0.5 • For 10,000 cases and 10,000 controls, and marker allele frequency 0.5, the upper tail of the distribution is well approximated by a Gamma distribution with mean μ = 1.78 and variance σ2 = 3.45
We develop a prediction equation to determine percentiles of the null distribution for smaller sample sizes and marker allele frequencies • We base goodness of fit on the root mean squared error (RMSE) of logeα, calculated for various sample size combinations, from the variance among 50 replicate samples:
With ~90% confidence, the true loge α lies in the interval logeα +1.645(RSME), i.e., α is within e+1.645(RSME) - fold of the true α • For total sample size (R + S) 200 or larger and α = 0.0001 or larger, in the very worst case (R = S = 100, α = 0.0001) with 90% confidence α could differ from the true α by a factor of at most ~ 4.8 • The average RMSE is 0.35, corresponding to being between 78% and 122% of the true α with 90% confidence
POWER Genetic Models Simulated • Each simulated population contains 500,000 individuals allowed to randomly mate for 50 generations after the appearance of a disease mutation • Marker loci placed at distances 0 – 6 cM from the disease susceptibility locus • For type I error, no association between the disease and marker loci
Tests Performed • Homogeneous populations • HWD, cases only • Allele test • Allele test x HWD in cases • HWD trend test • Cochran-Armitage trend test • Cochran-Armitage trend test x HWD trend test • Weighted average • Population stratification • Cochran-Armitage trend test with genomic control • Product of this and the HWD trend test • Weighted average with genomic control
Type I error, homogeneous population ∆ HWD test, cases only ▲ product of the allele test and HWD test
Type I error, population stratification ○ allele test ◊ Cochran-Armitage trend test ▲ product of the allele test and HWD test ■ weighted average test ● product of the Cochrn-Armitage trend test and the HWD test
Power, homogeneous population ■ weighted average test
Power, population stratification □ HWD trend test ♦ CA test with genomic control ■ weighted average with genomic control
Conclusions • Under recessive inheritance, the weighted average has better performance than either the Cochran-Armitage trend test or the HWD trend test • Has good performance for other models as well • The product of the Cochran-Armitage trend test statistic and the HWD test statistic (cases only) has better power, but has inflated Type I error if there is population stratification • The weighted average has good overall properties, automatically controls for marker mistyping
With acknowledgment to Kijoung Song
Can we use evolutionary models, when we have large amounts of genetic data on a sample of cases and controls, to obtain a more powerful way of detecting loci involved in the etiology of disease? Will these models bear fruit or nuts?