Module 21: Solar Activity & its Effects on Earth
440 likes | 711 Vues
Module 21: Solar Activity & its Effects on Earth. Activity 2: High-Energy Astronomy. Summary:.

Module 21: Solar Activity & its Effects on Earth
E N D
Presentation Transcript
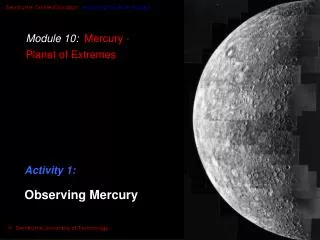
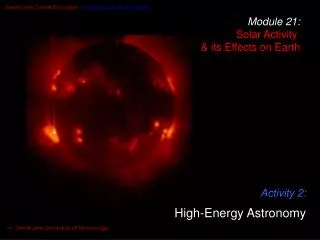
Module 21:Solar Activity & its Effects on Earth Activity 2: High-Energy Astronomy
Summary: In this Activity, you will learn about how the Sun’s ‘weather’ affects the Earth, and how the high-energy electromagnetic radiation from the Sun is monitored by astronomers on Earth. In particular, we will look at: • the active Sun and Earth’s upper atmosphere and climate; • high-energy processes in space; • detecting UV radiation - the IUE, EUVE; • detecting X-ray radiation - ROSAT, AXAF; • detecting -ray radiation- GRO & COMTEL; and • solar Connections - RHESSI X-ray imager and TIMED ultraviolet imager.
Time = 0 Sun produces burst of cosmic rays The Active Sun & the Earth During its active periods, the Sun emits solar cosmic rays. Those which reach Earth are mostly protons: that is, hydrogen atoms with no electrons (H+). The highest-energy particles arrive about 30 minutes after the flare’s maximum is seen on Earth, as the light reaches us before the particles can. Time = 8 minutes Light from burst reaches Earth Time = about 1/2 hr First (fastest) particles arrive Time = about 1 hrParticle flux at Earth is heaviest About one hour after the flare’s maximum, the number of particles reaches its peak. This radiation is very dangerous for astronauts, but on Earth we are shielded from it by the atmosphere.
Auroras (Northern & Southern Lights) When these particles approach Earth, they begin to experience Earth’s magnetic field and some become trapped. As the field is stronger near the poles (the clue is that the B field lines are close together) more particles are trapped there. Since moving charged particles create a magnetic field of their own, Earth’s magnetic field is distorted.
Atmospheric havoc A big solar flare can lead to heating of the outer layers of Earth’s atmosphere, and it expands slightly. The cosmic rays also affect short-wave radio transmissions. Satellites will tend to lose altitude; they may even re-enter the atmosphere and burn up. That’s ‘cause the Sun’stransmission is sodynamic! This radio transmissionis full of static...
The Earth’s Climate Lots of sunspots: higher T on Earth • Over the last few hundred years there have been two periods of very few sunspots: • The Maunder Minimum (MM), 1645 to 1715, and • The Little Maunder Minimum (LMM), from about 1800 to 1830. • During these periods, the temperatures in Europe were exceptionally low (especially during the Maunder Minimum). Earth’s temperatures Few sunspots: low T on Earth No. of sunspots
Scandinavia Greenland Canada The Sun Makes History From 800-1000AD, Erik the Red, his son Lief and others made numerous trips from Scandinavia to Greenland (so named by the entrepreneurial Erik to make it more attractive to potential settlers), with landings in northern Canada and perhaps even further south in the USA. Several Norse settlements flourished in Greenland until about 1200 AD, when they began to decline; by 1500 they were all abandoned. One major factor was the weather: there was a Little Ice Age, and like so many colonists (even today) the Norse failed to learn from the locals (most probably Inuit) how to adapt. When the Norse couldn’t cope with the increasingly cold, bitter weather, they returned to Europe. If it wasn’t for the Sun, the Norse would probably have colonised America 500 years before Columbus landed!
Carbon-dating Carbon-dating is not the process of going to the movies with a lump of coal, graphite or diamond! For some time people have worked out the age of rocks, tombs, and so on by finding out how much carbon-14 there is in them. The older the item, the less carbon-14 there is (because it decays). Carbon-14 dating is sensitive to the rate at which 14C is produced in the atmosphere by cosmic rays. Using carbon-dating, we can tell that there was very low solar activity in the MM and LMM, but also between 1410 and 1530, and before that, 1280 to 1340. These periods were known to be unusually cool … … as the Norse found out, to their chagrin.
Solar luminosity Solar luminosity is usually very stable, and varies only by about 0.1%. However the temperatures during the Maunder minimum tell us that the luminosity must have fallen by about 0.5%. Would this be enough to cause a Little Ice Age? We’re not sure: there are many other competing factors which can lower Earth’s surface temperature. For example, volcanoes and huge meteor impacts can fill the air with energy-absorbing dust, so the Earth will cool down.
High-Energy Processes in Space Let’s quickly revise what we have studied about electromagnetic radiation, cosmic rays and the Earth’s atmosphere. To begin with, the visible spectrum (which we call light) is only a very small part of the whole electromagnetic spectrum.
300 kHz 1 km Radio waves 30 MHz 10 m 3 GHz 10 cm 300 GHz 1 mm Microwave &Infrared wavelength frequency 3x10¹³ Hz 10 m 3x10¹⁵ Hz Ultraviolet 0.1 m 3x10¹⁷ Hz X rays 1 nm 3x10¹⁹ Hz 10-11 m Gamma rays 3x10²¹ Hz 10-13 m Visibleregion Click herefor info onnm, GHz etc.
Gamma rays Radio waves X rays Ultra-violet Infrared& Micro-wave Photons of different wavelengths can penetrate the Earth’s atmosphere to different depths. Visible Ground level
Gamma rays Radio waves X rays Ultra-violet Infrared& Micro-wave That means that on the surface of the Earth we can do a good job of detecting visible light and the higher-energy radio waves, but not much else. The good news is that we don’t get zapped by X-rays, scorched by the infra-red, or fried in the ultraviolet. Visible
Gamma rays Radio waves X rays Ultra-violet Infrared& Micro-wave Rockets to the rescue Visible These are observed from space, using rockets and satellites Enough of these radiations get through that we can also use upper-atmosphere stuff: balloons, and telescopes on high, dry mountains and in Antarctica Ground level
X rays UV IR/MW Radio From now on, when it is relevant, we are going to use this bar to showyou in which part of the spectrum the various instruments are working. Ultraviolet and X-ray astronomy detects high energy processes such as emissions from solar flares and from pulsars accreting (collecting) material from a stellar companion. There aren’t any pulsars in the Solar System, so we don’t study them here; they are covered in Exploring Stars and the Milky Way. Extremely energetic cosmic events produce GammaRayBursts - the origin of which is still not decided - possibly black holes colliding and merging!
X rays UV IR/MW Radio High-energy processes in the Sun are best studied using ultraviolet or X-ray detectors. We’re now going to examine some of the techniques and instruments used in detecting high-energy photons, most particularly from the Sun (because it’s the nearest star, and because it affects us so much here on Earth and in our space activities).
X rays UV IR/MW Radio This image shows X-ray emission from active regions on the Sun. Humans can’t see X-rays, so representative colour has been used to show their energy and intensity. X-ray images of active regions are much more informative than visible light images, because the high-energy processes which emit X-rays are concentrated over and within active regions. On the other hand, the lower-energy processes which emit visible light are spread out over the entire photosphere. We see sunspots, but not much else.
X rays UV IR/MW Radio IUE - The International Ultraviolet Explorer The IUE was launched in 1978 to provide a space telescope for ultraviolet astronomy. IUE was a collaborative project between NASA, ESA and the British SRC agencies. IUE’s estimated lifetime was 3 to 5 years. Amazingly, it continued to perform long after that. After 18 years, 8 months and 4 days it was finally shut down, having made over 100,000 observations of comets, planets, stars, novae, supernovae, galaxies, and quasars. Bravo, IUE!
X rays UV IR/MW Radio IUE Earth s intensity IUE was placed in geosynchronous orbit: that is, it stayed over the same spot on the Earth by orbiting once per day. The really beautiful thing about the IUE was that it could look at very small ranges of ultraviolet radiation, making lots of measurements close together. In fact, it could make 11,000 separate measurements as it scanned the ultraviolet band. For more information, visit the Internet site:http://www.esa.int/science/iue Lovely fine detail
EUVE - the Extreme Ultraviolet Explorer EUVE - the Extreme Ultraviolet Explorer
X rays UV IR/MW Radio Launched in June 1992, the EUVE observes at wavelengths between 7 and 76 nm, exploring astronomical spectra right up in the high energy UV, near the X-ray band. • It carries two sets of instruments: • The first set consists of three scanning telescopes, clustered together and aligned to point in the same direction, to carry out an all-sky survey of extreme ultraviolet sources. • The second set is the Deep Survey/Spectrometer Telescope, which combines a telescope to image very distant sources and a spectrometer to analyse radiation by wavelength. It was expected that the EUVE would have to be terminated in 1996, but it has been so successful that the mission ran until December 31, 2001, despite NASA funding constraints. EUVE re-entered the Earth’s atmosphere in late January 2002. For more information, visit the Internet site: http://ssl.berkeley.edu/euve/
X rays UV IR/MW Radio Detecting X-ray radiation We’ll now take a look at the Roentgen Satellite, known as ROSAT for short. ROSAT is an X-ray observatory: that is, it was built to observe and record radiation in the X-ray region of the spectrum. ROSAT was developed cooperatively by Germany, the US and the UK. ROSAT was launched in 1990, with an expected operational lifetime of 3 years… but lasted well beyond its anticipated lifetime. (These designers are better than they think!) The mission ended November 1999. For more information, visit the Internet site http://xte.gsfc.nasa.gov/docs/rosat/rosgof.html
X rays UV IR/MW Radio Chandra (formerly known as AXAF) The Chandra X-ray Observatory, named after the famous Indian-American astrophysicist and Nobel laurate Subrahmanyan Chandrasekhar,was launched in July 1999. It is now operating in its final, eccentric orbit which takes it one-third of the way to the Moon at apogee. This is necessary for an X-ray telescope because it needs to operate well out of the Earth’s atmosphere and Van Allen Belts. However it also means that the observatory cannot be serviced in case of a malfunction.
The Chandra X-ray Observatory being launched in July 1999 aboard the Shuttle Columbia
X rays UV IR/MW Radio Chandra’s special features Chandra improves on existing astronomical observation in the X-ray region in its spatial resolution which is an order of magnitude finer (0.5 arcsec on axis) than previously achieved. An order of magnitude is a factor of ten: that means that Chandra can “see” things in about ten times as much detail than previous X-ray missions.
X rays UV IR/MW Radio Chandra was also designed to have very good energy sensitivity from 0.1 to 10 keV, with high spectral resolution observations over most of this range. However as Chandra passed through the Earth’s radiation belts in its highly elliptical orbit in the first months of the mission, it was found to be focussing not only X-rays, but also protons & electrons from those radiation belts onto its detector chips. The chips are now being protected as Chandra passes through the radiation belts, but in the meantime degradation of its energy resolution chips has meant that Chandra’s energy resolution capabilities have dropped by a factor of 4, which may limit the scientific capabilities of the telescope. For more information, visit the Chandra Internet site http://chandra.harvard.edu/
X rays UV IR/MW Radio Detecting -ray radiation We cannot focus -rays but can obtain some positional information by tracking them through more than one detector. It’s a bit like the way we locate things using parallax: while one measurement gives you almost no information except a direction and an apparent size (in parsecs), two measurements give you such details as the distance to the object and its real size (in kilometres, for instance). And if you make more measurements, you can be more confident about the results as their accuracy will increase.
X rays UV IR/MW Radio CGRO The Arthur Holly Compton Gamma Ray Observatory was launched in April 1991. Arthur Holly Compton was a researcher who made great progress in his studies of gamma rays and how to detect them.
X rays UV IR/MW Radio CGRO contained several instruments, including COMPTEL - The Imaging Compton Telescope COMPTEL consisted of two detector arrays, 1.5 m apart, each containing a scintillator. A scintillator acted basically as an “amplifier”: Every time one gamma ray enters a scintillator, many gamma rays come out the other end. The mission ended June 2000. For more information about CGRO, visit:http://cossc.gsfc.nasa.gov/
Sun-Earth Connection NASA’s Sun-Earth Connection program aims to “Understand the Sun, Heliosphere and Planetary Environments as a Single Connected System” Currently 14 missions support the research program, including RHESSI, IMAGE and TIMED, and there are another 12 missions in development or under study. For more information, visit:http://sec.gsfc.nasa.gov/
Sun’s magnetic field and atmosphere affect each other Sun’s magnetic field and atmosphere affect those of Earth Earth’s magnetic field and atmosphere affect each other • Sun-Earth Connection focuses on • the Sun’s atmosphere and flares • the Sun’s magnetic field • the Earth’s upper atmosphere • the Earth’s magnetic field and • the coupling among them.
X rays UV IR/MW Radio RHESSI: Imaging solar flares The Reuven Ramaty* High-Energy Solar Spectroscopic Imager (RHESSI) was launched on Feb 2002 with the aim of studying particle acceleration and explosive energy release in solar flares. RHESSI combines high-resolution imaging in X-rays and gamma rays with high-resolution spectroscopy to pinpoint the location and dynamics of high-energy processes. For a mission update, visit the website: http://hesperia.gsfc.nasa.gov/hessi/ * Dr. Ramaty was a pioneer in the fields of solar physics and high energy astrophysics, and one of the founding members of the HESSI team.
X rays UV IR/MW Radio IMAGE The Imager for Magnetopause-to-Aurora Global Exploration (IMAGE) spacecraft was launched in March 2000. It the first satellite dedicated to imaging the Earth’s magnetosphere. The main goal of IMAGE is to determine the shape of the magnetosphere and how it changes in response to interplanetary disturbances. Its instruments can detect energetic neutral atom, observe extreme and far ultraviolet, and conduct radio sounding imaging. For more information, visit: http://pluto.space.swri.edu/IMAGE/
TIMED The Thermosphere, Ionosphere, Mesosphere Energetics and Dynamics (TIMED) mission uses remote sensing and imaging to help space scientists to understand the flow of energy through the complex transition region between space and the Earth. TIMED was successfully lunched on 7 December 2001, and is studying the Earth’s mesosphere and ionosphere. It has completed its initial 2 year orbital mission and is now in the extended mission phase. For mission updates, visit: http://www.timed.jhuapl.edu/
Solar Probe NASA’s Solar Probe will obtain the first in-situ measurements from within in the Sun’s corona. The mission objectives are to understand what heats the solar corona and how the solar wind is accelerated. The mission is currently under study and its proposed launch date is August 2012. For mission updates, visit: http://solarprobe.gsfc.nasa.gov/
Summary We have seen that there is some evidence that Earth’s weather can respond to major variations in the Sun’s activity, and that this also affects radio transmissions. High-energy radiation is also a hazard to astronauts. On Earth, we can detect and study visible light and some radio waves with reasonable success, but for the higher-energy photons it is necessary to use detectors in orbit in the upper atmosphere or in space. Some of these detectors, working in the X-ray, ultraviolet and gamma ray bands, were discussed.
Image Credits X-Ray Sun: ISAS, Yohkoh Project, SXT Grouphttp://antwrp.gsfc.nasa.gov/apod/image/9812/solsticesun_sxt.jpg Sunspots: National Solar Observatoryhttp://antwrp.gsfc.nasa.gov/apod/image/9701/sunspot_nso.jpg Aurora overhead, in Alaskahttp://antwrp.gsfc.nasa.gov/apod/image/9811/aurora2_jc_big.jpg The International Ultraviolet Explorer http://antwrp.gsfc.nasa.gov/apod/image/iue_logo.gif The Extreme Ultraviolet Explorer http://w3.cea.berkeley.edu/image/papers/sci_archive_pubs_papers_539_539_f3.gif ROSAT satellite http://heasarc.gsfc.nasa.gov/Images/rosat/rosat_sat.html AXAF http://hea-www.harvard.edu/asc/gifs/AXAF-smaller2.gif Arthur Holly Compton Gamma Ray Observatory http://erbscobe.gsfc.nasa.gov/groviewt.gif Chandra X-ray Observatory Launch in the Shuttle Columbia http://chandra.harvard.edu/
Image Credits RHESSI - NASA http://hesperia.gsfc.nasa.gov/hessi/images/hessi1a.jpg Solar Probe - NASA http://solarprobe.gsfc.nasa.gov/sp_relative2human.jpg IMAGE - NASA http://image.gsfc.nasa.gov/image/image_logo.jpg TIMED - NASA http://stp.gsfc.nasa.gov/missions/timed/images/timed.2.jpg
Now return to the Module home page, and read more about the Sun, weather and instrumentation in the Textbook Readings. Hit the Esc key (escape) to return to the Module 21 Home Page
Conversion The table below may assist you when converting between photon frequency, wavelength and energy. Region Wavelength Frequency Energy hard gamma 1 x 10⁻⁹ nm 3x1026 Hz 1.2 x 10¹² eV gamma 1 x 10⁻⁶ nm 3x10²³ Hz 1.2 GeV gamma/X-ray 0.001 nm 3x10¹⁹ Hz 12 MeV X-ray 1 nm 3x10¹⁷ Hz 120 keV X-ray/UV 10 nm 3x10¹⁶ Hz 12 keV UV 100 nm 3x10¹⁵ Hz 1.2 keV visible (blue) 400 nm 7.5x10¹⁷ Hz 3.1 eV visible (red) 700 nm 4.3x10¹⁷ Hz 1.8 eV IR 10000 nm 3x10¹³ Hz 0.12 eV MW 1 cm 30 GHz 1.2 x 10⁻⁴ eV MW/radio 10 cm 3 GHz 1.2 x 10⁻⁵ eV radio 100 m 3 MHz 1.2 x 10⁻⁸ eV radio 100 km 3 kHz 1.2 x 10⁻¹¹ eV Please see the next slide for explanations of nm, eV etc.
Explanations The formulae that were used to make the conversions in the table are: nm = nanometer The prefix nano- means 10-9, so a nanometer is 0.000000001 metre. Hz = hertz Hertz is the unit given to frequency of a waveform, in cycles per second. GHz = gigahertz The prefix giga- means 109 , so a GHz is a billion cycles per second. MHz = megahertz Mega- means 106, so a MHz is a million cycles per second. eV = electron-volts The electron-volt is a unit of energy: it is the energy involved in moving an electron through a potential difference of 1 volt. 1 eV = 1.60 x 10⁻¹⁹ J ( joules), where 1 J is (roughly) the energy you’d expend if you lifted a mass of 1 kg to a place 10 cm higher.
Return to the Activity