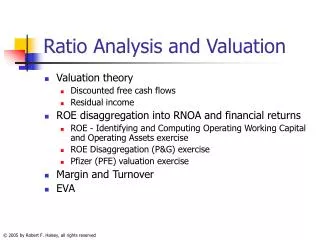
Valuation Analysis
Valuation Analysis. Judson W. Russell, Ph.D., CFA University of North Carolina-Charlotte. Agenda. Equity Valuation Fundamentals: Intrinsic Value Enterprise Valuation Fundamentals: Free Cash Flow Equity Valuation Fundamentals: Relative Value. Introduction.

Valuation Analysis
E N D
Presentation Transcript
Valuation Analysis Judson W. Russell, Ph.D., CFA University of North Carolina-Charlotte
Agenda • Equity Valuation Fundamentals: Intrinsic Value • Enterprise Valuation Fundamentals: Free Cash Flow • Equity Valuation Fundamentals: Relative Value
Introduction • Valuation is both art and science • Art through reasonable, defensible: • Assumptions • Judgment and interpretation of data • Science through application of analytical formulae • Valuation is based on future performance
Introduction • Two main valuation questions: • What is a company worth by valuation metrics? 2) What can or will a potential buyer pay?
Introduction • Three main valuation methodologies • Intrinsic Value Approach: A stock’s price equals the net present value of its dividends. • Relative Value Approach: A stock’s value is determined by comparing similar stock values. • Acquisition Value Approach: Calculate a company’s stock price by determining its worth to a third party acquirer. • Golden Rule: Footnote your assumptions
Introduction • EQUITY VALUE: • Value of shareholders’ interest • After interest expense, preferred dividends and minority interest expense • Multiples of net income, book value, EPS • Other common terms: • Market Value, Market Capitalization, Offer Value (in an acquisition context)
Introduction • ENTERPRISE VALUE: • Includes all forms of capital • Market value of equity, debt, preferred stock, minority interest • Before interest expense, preferred dividends and minority interest expense • Multiples of sales, EBITDA, EBIT or any other applicable metric (per subscriber, per bed, etc.) • Other common terms: • Aggregate Value, Firm Value, Total Capitalization, Adjusted Market Value, Transaction Value
Introduction Equity Market Cap. = EnterpriseValue Equity Market Cap. Net Debt Preferred Stock Minority Interest
Introduction • COMPARABLE (or “similar”) in terms of:
The Graham and Dodd Approach to Security Selection Study the available facts Prepare an organized report Project earnings and related data Draw valuation conclusions based on established principles and sound logic Make a decision Equity Valuation Process
The top-down approach starts with an analysis of alternative economies and security markets. The initial objective is to decide how to allocate investment funds among countries and within countries to bonds, stocks, and cash. The second phase is the analysis of alternative industries. The objective at this stage is to determine which industries will prosper based on your analysis of the economy. The final, third, phase focuses on security selection. The objective is to determine which companies within the selected industries will prosper and which stocks are undervalued. Valuation Process Analysis of Alternative Economies and Security Markets Analysis of Alternative Industries Analysis of Individual Companies and Stocks
The top-down analysis for a U.S. homebuilder: Economy GDP will increase 3% Capital Markets Interest rates will remain low Industry Housing starts to stay strong Homebuilding Company Homebuilder to gain market share. Sales will increase by 15% versus the industry average of 10%. Steady profit margins signify a 15% earnings increase. Valuation Process Example
Forecast Sales An insightful analysis when predicting industry sales is to view the industry over time and divide its development into stages. Pioneering development - A Rapid accelerating growth - B Mature growth - C Stabilization and market maturity - D Deceleration of growth and decline - E Industry Analysis Rate of Sales Growth D C E B A Time
The value of an asset is the present value of its expected returns. The process of valuation requires estimates of (1) the stream of expected returns and (2) the required rate of return on the investment. The value of a preferred stock (perpetuity) is simply the stated annual dividend divided by the required rate of return on preferred stock (kp). A preferred stock with an $8 per year dividend and required return of 9% is valued as: V = $8 / 0.09 = $88.89 Valuation Approaches – Intrinsic Value
The valuation of common stock is more difficult than bonds or preferred stock because an investor is uncertain about the size of the returns, the time pattern of returns, and the required rate of return (ke). However, the value of common stock is still the present value of its future cash flows. The only cash flows an equity investor ever gets are dividends (cash or liquidating). A model to value common stock is the dividend discount model (DDM). Valuation Approaches – Intrinsic Value
The DDM assumes that the value of a share of common stock is the present value of all future dividends as; V = [D1/(1+ke)1 + D2/(1+ke)2 + … + D/(1+ke)] Since estimating D is impossible, other methods have evolved based upon a terminal stock value, or a constant rate of growth. Valuation Approaches – Intrinsic Value
Assume an investor wants to buy a stock, hold it for one year, and then sell it. We must evaluate the dividend cash flows as well as the terminal value in one year. These cash flows are then discounted at the investor’s required rate of return. A company earned $2.50 a share last year and paid a $1 dividend (40% dividend payout). The firm has a consistent record regarding payout and we expect it to earn $2.75 per share during the coming year. We expect the stock to trade at $22 at the end of the coming year. Further, the risk-free rate is 5%, the market return is 10%, and the stock’s beta is 1.2. ke = rf + b(E(rm) – rf ) = 5 + 1.2 (10-5) = 11%, D1 = E1(dividend payout) = $2.75(.4) = $1.10 V = [D1/(1+ke)1 + Stock Value1/(1+ke)1] V = [$1.10/(1+.11)1 + $22/(1+.11)1] V = 0.99 + 19.82 = $20.81 Valuation Approaches – Intrinsic Value
When valuing a firm with an infinite holding period we assume that dividends, at some point, exhibit a constant rate of growth. Assume that a firm is in a state of constant growth, we can value the infinite stream of cash flows using the following abbreviated formula: V = D1/(ke - g) For instance, in our previous example let’s assume that the holding period is infinite and the firm’s dividends are growing at 6% per year perpetually. The dividend in one year was $1.10 and the required rate of return was 11%. V = $1.10/(.11- .06) = $22.00 Valuation Approaches – Intrinsic Value
We can employ the same technique for firm’s that have varying rates of growth by assuming that the growth rate becomes constant, at some point. For instance, suppose we have a firm experiencing rapid growth due to its position in the product cycle. At some point the growth rate has to slow or the firm will become the market! We can accommodate this scenario with a multistage model by discounting the rapid growth phase dividends individually and then determining the terminal value using the constant growth methodology. V = [D1/(1+ke)1 + D2/(1+ke)2 + … + (Dn+1/(ke-g)) /(1+ke)n] Valuation Approaches – Intrinsic Value
Suppose that ABC Company has a current dividend of $1.00 per share with growth expectations of 20% for each of the next two years. After that point, the firm expects dividends to grow at 4% each year indefinitely. Given a cost of equity of 11%, calculate the value of the firm’s shares. V = [D1/(1+ke)1 + D2/(1+ke)2 + V2/(1+ke)2] where V2= D3/(ke –g) V = [$1.20/(1+.11)1 + $1.44/(1+.11)2 + ($1.50/(.11-.04)) /(1+.11)2] V = $1.08 + $1.17 + $17.39 = $19.64 Valuation Approaches – Intrinsic Value
Valuation Approach – Intrinsic Value • DISCOUNTED CASH FLOW ANALYSIS • Intrinsic value of the company • Unlevered free cash flows • Independent of capital structure • Free cash flows generated by the assets that are available to all capital holders • Present value of: (1) free cash flows and (2) projected terminal value • Terminal value is used to estimate value beyond the forecast period • Exit Multiple Method (assumes the sale of the business) • Perpetuity Growth Rate Method (3) Discount rate = Weighted average cost of capital (WACC) WACC = ka = wdkd(1-t) + weke
Free Cash Flow Analysis … ∞ FCF1 FCF2 FCF3 FCF4 FCF5 FCFn How do we account for the remaining cash flows of the firm? Terminal Value Approach Constant Growth Method
Terminal Value Calculation A. The Exit Multiple Method
The Present Value of the Terminal Value Discounted Cash Flow Analysis
Terminal Value as % of Enterprise Value Discounted Cash Flow Analysis • Provides a reality check of the DCF value • Higher the %, more of the Enterprise Value is being realized with the assumed sale of the business at the end of the forecast period • Confidence level in the 70-85% range, depending on the company and situation
Terminal Value as % of Enterprise Value Discounted Cash Flow Analysis • How much of the Enterprise Value for the Company is being generated by the Terminal Value? • What is your comfort level with this percentage? Present Value of Exit Multiple = $417 Enterprise Value = $589.7 Percentage = $417/$589.7 = 70.7%
Terminal Value Calculation B. The Perpetuity Growth Method
Discounted Cash Flow Analysis • Now we’ll look at the perpetuity growth technique to capture the terminal value of Company. • The terminal value captures all future cash flows of the firm assuming a constant growth factor. • The operating cash flow of the firm in 2010 is $55.5. Assuming a growth rate of 4% the operating cash flow in 2011 would be $57.72. • We have a discount factor of 12% and a growth factor of 4% with a cash flow of $57.72.
Perpetuity Growth Formula Discounted Cash Flow Analysis Terminal Value = FCFN+1 (ka - g) where: FCFN+1 = steady-state free cash flow in period N+1 g = nominal perpetual growth rate ka = discount rate Terminal Value = $55.5(1.04) =$57.72= $721.5 .12-.04 0.08 Present Value of Perpetuity Growth Terminal Value = $721.5/(1.12^5) = $409.40
How do we use relative value? • The hardest part of relative value is finding comparable firms. • Once you have a decent list of comparables you need to determine which scaling variable to? • Next, you want to compare your target firm’s multiple to the average of the comparable set. • Finally, make sure that you account for differences, e.g. leverage, market position, patents, etc.
Investors prefer to estimate the value of common stock using an earnings multiplier model. P0 = D1/(ke - g) Divide both sides by next year’s projected earnings: P0/E1 = (D1/E1)(1/(ke - g)) The P/E ratio (forward) is determined by: The expected dividend payout ratio (D1/E1) The required rate of return on the stock (ke) The expected growth rate of dividends (g) Relative Value
Assume that a firm has an expected dividend payout of 40%, a required rate of return of 11%, and a growth rate of dividends of 6%. Next year’s earnings (E1) are expected to be $2.75. P0/E1 = (.40)(1/(.11-.06)) = 8.0x The value of the stock today is based on the P/E1 and estimate of E1. P0 = P0/E1 x E1 = 8.0 x $2.75 = $22.00 Relative Value
The best known measure of relative value for common stock is the P/E ratio or the earnings multiplier. Analysts have also turned their attention to other measures of relative value: Price/book value (P/BV) : market value of the company divided by its book value. This metric is used a great deal with financial stocks since many of their assets are carried at values very close to market value. This metric can be used for firms with negative earnings or cash flows. Several studies have indicated that P/BV is a good indicator of future performance. Price/cash flow (P/CF) : market value of the company divided by its cash flow. Price/sales (P/S) : market value of the company divided by its sales. Relative Value
When a firm retains earnings and acquires assets, if it earns some positive rate of return on these additional assets, the total earnings of the firm will increase. The rate of earnings growth depends on the proportion of earnings retained and the rate of return it earns on the new assets acquired. Specifically, the growth rate (g) of equity earnings without external financing is equal to the percentage of net earnings retained (retention rate, b) times the rate of return on equity capital (ROE). g = (retention rate)(return on equity) g = (b)(ROE) This growth rate is called the internal or sustainable growth rate. The firm can increase its rate of growth by 1) retaining a larger portion of its earnings for reinvestment in the firm or 2) increasing its ROE (recall, ROE = profit margin x total asset turnover x financial leverage). Expected Growth Rate
Firm XYZ is trading at $18 currently. Last year’s earnings were $2.00 per share. The firm’s ROE is 10% and you expect it to stay that way for the foreseeable future. The firm has a stable dividend payout policy of 40%. The current nominal risk-free rate is 7%, the expected market return is 12% and XYZ’s beta is 1.2. Value XYZ and indicate what you should do based on your estimate. Determine required rate of return: ke = 7% + 1.2(12%-7%) = 13% Determine growth rate: g = (.60)(10%) = 6% Determine last year’s dividend: $2.00(.40) = $0.80. Determine next year’s dividend: D1 = D0(1+g) = $0.80(1.06) = $0.85 Calculate the value projection: V = D1/(ke - g) = $0.85/(.13-.06) = $12.14 Compare the stock value to its current market price: $12.14 vs. $18.00 Sell recommendation. Pulling it all together
Valuation Analysis 2. Overview of Conrail Inc.
Conrail Inc. Company Description • Conrail, through its wholly-owned subsidiary Consolidated Rail Corporation, provides freight transportation services within the northeast and midwest United States. Conrail interchanges freight with other United States and Canadian railroads for transport to destinations within and outside Conrail's service region. Conrail operates no significant line of business other than the freight railroad business and does not provide common carrier passenger or commuter train service. • Consolidated Rail Corporation is a Pennsylvania corporation incorporated on February 10, 1976 to acquire, pursuant to the Regional Rail Reorganization Act of 1973, the rail properties of many of the railroads in the northeast and midwest region of the United States which had gone bankrupt during the early 1970's, the largest of which was the Penn Central Transportation Company ("Penn Central"). The US government sold its 85% stake to the public in 1987.
CSX and Norfolk Southern Analysis of Potential Acquirers • Conrail is the ideal extension for both into the Northeast • “Northeast corridor” is a must for a transcontinental railroad • Strategic positioning with 2 major Western rails
Financial Overview of Conrail The Conrail Case Study • Date: October 14, 1996 (pre-CSX merger announcement)
3. Comparable Public Company Analysis “Analysis of Selected Publicly Traded Companies” “Public Comparables” “Trading Comparables” “Comp Co’s” “Common Stock Comparisons”
Comparable Public Company Analysis Determining the Appropriate Universe • Previous analyses of other bankers • Industry specialists • M&A • Proxy Statement - “Peer group index” • 10-K / IPO Prospectus - “Competition section” • Research (respect the Chinese Wall) • S&P Tearsheets, Value Line, Bloomberg • SIC code screen from FactSet • Company’s views
Comparable Public Company Analysis Public Information Checklist 1) Most recent 10-K and/or annual report 2) 10-Q from latest quarter 3) News announcements (before required filing) 4) Research reports and EPS estimates • Use SEC-filed documents whenever possible
Valuation Analysis What comparables should be used to value Conrail?