Writing Task 1: Describing data in a table
270 likes | 1.53k Vues
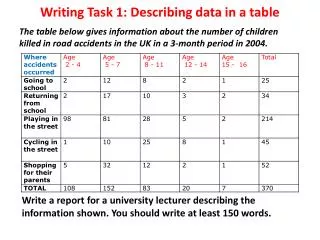
The table below gives information about the number of children killed in road accidents in the UK in a 3-month period in 2004. Writing Task 1: Describing data in a table. Write a report for a university lecturer describing the information shown. You should write at least 150 words. .

Writing Task 1: Describing data in a table
E N D
Presentation Transcript
The table below gives information about the number of children killed in road accidents in the UK in a 3-month period in 2004. Writing Task 1: Describing data in a table • Write a report for a university lecturer describing the information shown. You should write at least 150 words.
The table below gives information about the number of children killed in road accidents in the UK in a 3-month period in 2004. Table Introduction • Look at the table and decide what the table is describing.
Possible introduction The table shows the number of fatal accidents which took place on the roads in the UK in a 3-month period in 2004. Five places are mentioned where the accidents happened, and the information is divided into 5 age groups.
Now you can look at the details in the table and decide how to use the information in the body of your essay. If you look at the total figures we can see one area where there were far more accidents than elsewhere.
We can write: The highest number of accidents took place while playing in the street. Most of these accidents happened to children aged between 2 and 7. Older children were hardly involved at all with accidents in the street with only 7 cases between the ages of 11 and 16 out of 214.
The next highest areas were shopping for parents and cycling in the street. Shopping for parents accounted for 52 accidents, with 46 of these occurring between the ages of 5 and 11. The same age category was also involved in most accidents concerning cycling in the street, accounting for 45 out of the 52 accidents. Journeys to and from school had the least number of accidents, although younger school children were more involved than the older age groups.
Now look at the overall picture for your conclusion. We can see younger children were involved in the majority of accidents • To conclude, the table shows that the highest number of accidents involved younger children. Those between 2 and 7 accounted for almost two thirds of the total.
Describing a table • The table shows the number of road accidents which involved children in 1995. Five age groups were mentioned. • The highest number of accidents was playing in the street with 214 out of a total of 370. The vast majority of these involved children between 2 and 7. The number dropped in each age group and there were only 2 of this type of accident amongst 14 to 16 year olds. Shopping for parents accounted for 52 accidents, with the highest figure being in the 5 to 7 group. Cycling in the street came next with the most accidents amongst children aged between 5 and 13. Journeys to and from school were the least number of accidents although younger school children were more likely to be involved.
To conclude, the table shows that the highest number of accidents involved younger children. Children aged between 2 and 7 accounted for 260 accidents which is around two thirds of the total.