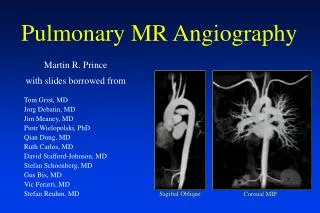

Angiography
E N D
Presentation Transcript
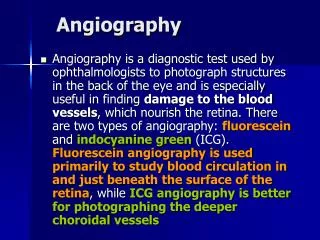
Angiography • Angiography is a diagnostic test used by ophthalmologists to photograph structures in the back of the eye and is especially useful in finding damage to the blood vessels, which nourish the retina. There are two types of angiography: fluorescein and indocyanine green (ICG). Fluorescein angiography is used primarily to study blood circulation in and just beneath the surface of the retina, while ICG angiography is better for photographing the deeper choroidal vessels
Floursein angiography • F A provides excellent spatial and temporal resolution of the retinal circulation with a high degree of fluorescence efficiency. • Unfortunately, FA has limitations, particularly with respect to imaging the choroidal circulation secondary to poor transmission of fluorescence through ocular media opacifications, fundus pigmentation and pathologic manifestations, such as serosanguineous fluid and lipid exudation.
Fluorescein Angiography • Since its introduction in the 1960s, A small amount of vegetable-based dye (sodium fluorescein) which is either orange or yellow in color) is injected into an arm vein followed by a rapid, timed sequence of retinal photographs provides images of the retinal blood vessels at work. Dye passes first through the arteries, reaching the capillaries next and finally leaving the retinal circulation through the veins.. Of primary importance is the identification of dye leakage from previously normal blood vessels. Hypoflourescence or hyperflourescencemay be noticed. Angiography is a very important guide to the treatment.
fluorescein angiography • . The dye travels through the circulatory system in about 15 seconds, reaches the blood vessels in the retina and the choroid, the major blood vessel of the eye lying between the retina and the sclera. • During a period of 2 to 5 seconds, the dye travels through the capillaries and fills the veins. Rapid, sequential black and white photographs. Another set of photographs may be taken about 15 minutes later in order to show staining or pooling that can possibly indicate leakage or swelling on the retina. These photographs will detect any abnormalities in the retina that are not visible by other procedures. • Fluorescein angiography takes about 20 to 30 minutes and is virtually painless. After the test is complete, the pupils may remain dilated for several hours, so it is a good idea to arrange for another person to provide your transportation home.
ICG Angiography • Indocyanine green (ICG) is an intravenous dye which has been used for many years to study blood flow in the heart. In the past several years, techniques have been developed to use ICG to image ocular blood vessels, the choroid. Leaky or abnormal blood vessels in the choroid are a common problem for people with macular degeneration, but traditional fluorescien angiography is sometimes unable to clearly identify these abnormal blood vessels under the retina. Because of its unique properties, ICG is able to delineate this process more clearly in as many as 40% of patients in whom fluorescein angiography is inconclusive.
ICG BASICS • ICG absorbs light in the near-infrared range of 790 nm to 805 nm. The emission spectrum ranges from 770 nm to 880 nm, peaking at 835 nm. The physical characteristics of ICG allow for visualization of the dye through overlying melaninand xanthophyl. ICG molecule is larger (molecular weight, 775 d vs. 332 d for fluorescein) and more protein-bound in plasma than is fluorescein and fluoresces in the infrared spectrum
F A – I C G ICG angiography was performed with infrared photographic film. However, the poor sensitivity of film coupled with the relatively weak fluorescence properties of the dye caused this method to be abandoned. The strong binding of ICG dye to plasma proteins Because it has both lipophilic and hydrophilic properties, (ICG is 98% protein-bound in vivo) results in slow leakage as compared with fluorescein and reduces the amount of extravascular fluorescence available for imaging. Digital videocameras have been used to capture images for ICG angiography. This has made ICG angiography a useful clinical diagnostic tool, particularly for imaging of subretinal neovascular membranes in cases where such membranes can not be adequately imaged with fluorescein angiography
High speed angiography of a patient with choroidal neovascularization (white arrows) demonstrates clearly the perfusing and draining feeder vessels (black arrow).
I C G angiography • The activity of ICG in the near-infrared light also allows visualization through serosanguineous fluid, shallow hemorrhage, pigment and lipidexudate The result is enhanced imaging of conditions such as choroidal neovascularization and pigment epithelium detachment. Images are usually taken at intervals at least up to thirty minutes, and perhaps as long as an hour after the injection.
Fluorescein angiography reveals occult choroidal neovascularization. Fig. 3B: Late phase ICG angiogram shows a well-defined plaque.
For particular types of Macular Degeneration, ICG can help see more detail. In this photo, we see a large area of blood. In most cases, we cannot see though this blood so we cannot be certain as to what is underneath. A fluorescein angiogram can give some detail, but we still cannot see through the area of blood. Because ICG angiogram uses near infra-red light, we can easily see through the area of blood. Notice that we cannot even see the outline of the blood in this photograph.
Fig. 7A: Color composite photograph shows large subretinal and intraretinal hemorrhages at the posterior pole and surrounding the optic nerve. There are areas with dense lipid exudation. Fig. 7B: Mid-phase ICG angiogram illustrates a large hyperfluorescent area. In the peripapillary area, a net of subretinal inner choroidal vessels terminates in polypoidal
Recurrent Choroidal New VesselA. Late Phase Fluorescein AngiographyB. Late Phase ICG Angiography
A. Mid Phase Fluorescein AngiographyB. Late Phase ICG Angiography
S L O . Ophthalmoscopy 1850 . Fundus photography 1863 . First commercially available fundus camera 1925 . Televised ophthalmoscopy 1949 (bulky & impractical extensive light) . Flying spot T V ophthalmoscope 1980 using laser light . Scanning laser ophthalmoscope (1/1000 light) piece by piece fundus imaging, 0.9 mm for illumination, the remained pupil for observation pupillary dilation not always necessary
S L O • Scanning laser ophthalmoscopy is a retinal imaging technique that is based on the standard scanning laser microscope. The important difference in S L O is Using infrared laser light when equipped with a confocal aperture, offer fundamentally better performance than conventional imaging instruments (Wilson, 1984). The confocal SLO generates high contrast images and can do optical slicing through weakly scattering media making it ideal for imaging the multilayered retina.
S L O • Resolution of retinal images is limited by blur caused by the aberrations in the optical system of the eye. However, that imaging could be improved if I carefully aligned the beam to image through the least aberrated areas of the optical system. To facilitate high resolution imaging, the Waterloo CSLO was adapted to image a 1.5 degree field on the retina with 512 X 512 pixels at 30 frames per second. To ensure a high cut-off frequency, the entrance beam size was 0.9 mm. To collect as much light as possible, the entire dilated pupil was used in the return path. Precise control of the entrance beam position was done with an infra-red pupil position monitor.
Confocal S L O . Placing a pinhole in front of the detector, only light which is reflected from the focal point of the laser is detected by the photodetector. The scattered and reflected from other retinal layers is ignored. The major advantages are reduced light intensity to image the retina and better contrast images due to single point scanning which reduces the effect of scattered light. . Different retinal structures ( layers) and choroid are viewed doing tomography and volumetric evaluation of different structures (x _ y & Z axis). Further improvement in imaging and measuring different structures. the quality of imaging is improoved by using adaptive optics to compensate the aberrations
Colour Scanning Laser Ophthalmoscope : This is a patented technique of using three lasers, red, green and blue to capture a true color image of the retina. By changing the wave length and the focal plane of laser light different retinal and subretinal layers are viewed in different colors (longer waves for deeper layers).
Topographic Images: A - Single Gaussian; B - Double Gaussians. (Black - more deep; White - Less deep)
Thickness image. A - Single Gaussian; B - Double Gaussian. (Black - thicker; White - thinner)
S L O • Stratus OCT (Zeiss-Humphrey, Dublin, CA) • Heidelberg Retinal Tomography II (HRT II, Heidelberg Engineering, Germany) • Heidelberg Retinal Angiography 2 (HRA 2, Heidelberg Engineering, Germany) • Fluorescein Angiography (FA) • Indocyanine Green Angiography (ICG)
S L O & F A • Another approach to fluorescence angiography (using either fluorescein or ICG) is the scanning laser ophthalmoscopeThis instrument has come into common clinical practice because of its commercialization in recent years. Advantages of the scanning laser ophthalmoscope include the ability to use an excitation light that scans the retina, allowing more intense excitation (thus providing a stronger emission signal) while still using safe levels of illumination. This is possible because the scanning beam illuminateseach area point of the retina for only 0.1 to 0.7 microseconds. Scanning laser ophthalmoscope angiography gives temporal information that is richer than still ("digital") imaging systems because true video allows imaging at rates of 20 to 30 frames per second. This allows more detail to be seen in the transit phases and may give better information about patterns of leaking vessels. Furthermore, the illuminating beam is monochromatic and the intensity of fluorescence may be higher because of the scanning laser ophthalmoscope beam and the fact that point-by-point illumination is used. Stereoscopic imaging is also possible using scanning laser ophthalmoscope techniques.
Confocal S L O for ICG • we adapted the scanning laser tomograph to perform ICG angiography. The instrument allowed better discrimination against out-of-focus objects (tomography) and provided higher contrast than other systems. The simple optical path and optimized excitation and emission detection systems improved the sensitivity of the instrument so that 70% of the photons exiting the eye could be detected. This allowed excellent visualization of vessels in the late stages (45 minutes) of the ICG angiogram without the use of a second ("landmark") injection of ICG dye. This instrument was the first completely digital instrument to allow scanning laser video angiography. Image capture and processing is done digitally so that no information is lost at any stage of processing, image manipulation, or transmission.
Cell tracking using SLO angiography • Leukocytes play a central role in the pathogenesis of retinal and choroidal inflammatory disease. The infiltration of these cells into retinal and choroidal tissues may lead to tissue destruction and vision loss. Such infiltration requires the cells to pass from the intravascular space into extravascular space. However, until recently it was not possible to observe this movement of the leukocytes in-vivo. • The scanning laser ophthalmoscope (SLO) provides real-time images of the ocular fundus, which may be used to visualise leukocyte traffic in-vivoby labelling leukocytes with a fluorescent dye. The real-time nature of the method allows the velocity of the cells to be measured. Software was developed to automatically locate cells from their appearance on the interlaced image frames, measure the distance travelled and calculate the cell velocities in different parts of the retina.
We measured the average location of the ring in each of the above figures to estimate the photoreceptor spatial frequency as a function of retinal eccentricity (see figure 4).
The photoreceptor array was studied by taking the average power spectra from a sequence of images (see figure 3). The power spectrum is useful because it is useful to detect periodic structure and is translation invariant.