Download
1 / 20
200 likes | 318 Vues
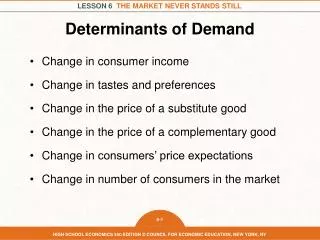
The Determinants of Demand for Hybrid Cars. Shad Ahmed Mark Baldwin Kelly Fogarty Michael Kendra. Overview. Objectives Hypotheses / Variable Examined Software Approach Model Variables Statistics Results Policy Implications. Objectives.

E N D
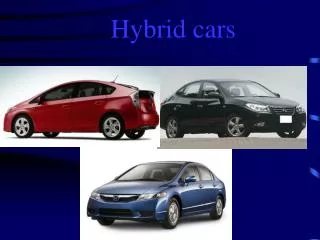
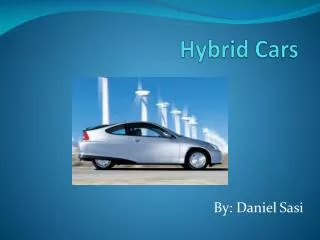
The Determinants of Demand for Hybrid Cars Shad Ahmed Mark Baldwin Kelly Fogarty Michael Kendra
Overview Objectives Hypotheses / Variable Examined Software Approach Model Variables Statistics Results Policy Implications
Objectives • To develop an econometric model and analyze historical data sets to determine which variables explains what factors drive the demand for hybrid vehicles in order to confirm or deny public speculation. • To maximize the statistical significance of the model in order to provide forecasters with a working model that can be used to make predictions about future demand for hybrid cars. • To provide the environmentally conscience public, automobile industry, and law makers a foundation upon which to make policy decisions based on objective reasoning. • To provide a solid foundational model upon which future research projects can build on.
Hypotheses • H1: The demand for hybrid cars is explained by gas prices. • H2 : The demand for hybrid cars is explained by the Producers Price Index for automobiles. • H3: The demand for hybrid cars is explained by the personal consumption on expenditures for automobiles by the US population
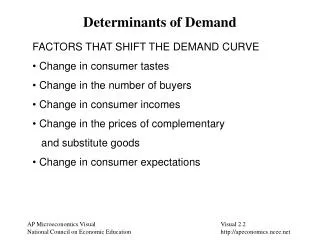
Economic Indicators PPI for motor vehicles Personal consumption on motor vehicles Bank loan rate Consumer credit outstanding Unemployment rate Energy Indicators Price of gasoline Barrels of gasoline consumed Total energy consumption of US population Variables examinedDependent variable: Demand for hybrid vehicles
Variable Identification and Definition VariableTypeHypothesized Sign • Demand for Hybrid Cars Dep • PPI for motor vehicles End Neg • Personal consumption on End Pos motor vehicles • Bank loan rate Exo Neg • Consumer credit outstanding Exo Pos • Unemployment rate Exo Neg • Price of gasoline End Pos • Barrels of gasoline consumed End Pos • Total energy consumption of End Pos US population
Software • WinORSfx was used to develop the model. • Availability of Economic data from Economagic • Extensive ability to determine statistical significance.
Approach • Monthly data sets were used from 2004 – 2007. • Stepwise regression was run to determine which variables to eliminate from the model. • Remaining variables were examined for practicality. • Ordinary Least Square method was used to test the remaining variables for multicollinearity, homoscedasticity, explainability, and serial correlation. • First Difference was run to attempt to eliminate serial correlation. • A final model was assembled.
Determinants Model Qx = -167376 + 758*P + 163.20*Pgas + .104C Qx = Demand for hybrid vehicles P = PPI for automobiles Pgas = Price of gasoline C = Personal consumption of automobiles
F-statistic • The P-value 0.00001 is significantly below the critical value, 0.05 • The model is statistically significant above the 95% confidence interval F value: 44.63 P value: 0.00001
Coefficient of Determination • Demonstrates that a high degree of variability in hybrid sales can be explained by variation in the independent variables • Root MSE 3489.600 • SSQ(Res) 426205816.031 • Dep.Mean 15818.923 • Coef of Var (CV) 22.060% • Multiple R 89.038% • R-Squared 79.278% • Adj R-Squared 77.502%
Multicollinearity • No evidence of multicollinearity is present in the model (VIF<10) Average VIF = 1.037
Parameter VIFs Variable:VIF Price of gasoline 1.040 PPI of automobiles 1.053 Personal consumption on 1.018 Automobiles
Constant Variance • White’s Test shows that the model is homoskedastistic White’s Test = 8.32 P-Value for White’s = .502
Auto Correlation • Durbin Watson test shows evidence of Auto Correlation • Ho: Rho = 0 • Rho: Pos & Neg Reject • Rho: Positive Do Not Reject • Rho: Negative Reject • First difference solution attempted; resulted in a new R-squared value of .277
Elasticities VariableParameter Estimate Price of gasoline 2.89 PPI of automobiles 8.38 Personal consumption on 3.87 Automobiles
Elasticity Implications • Income elasticity • Hybrids are a “luxury” item • Elasticity is >1 • As income increases, Qx increases • Cross price elasticity • Gasoline and other automobiles are substitutes • Elasticity is >1 • As prices of gasoline and other autos increases, Qx increases