Signal processing for chemical sensors
290 likes | 556 Vues
Signal processing for chemical sensors. Martin Holmberg S-SENCE Applied Physics, Department of Physics and Measurement Technology (IFM) Linköping University. Human olfactory system. a large number of olfactory cells ( 10 million) but only a small number of sensitivity classes ( 3 0)

Signal processing for chemical sensors
E N D
Presentation Transcript
Signal processing for chemical sensors Martin Holmberg S-SENCE Applied Physics, Department of Physics and Measurement Technology (IFM) Linköping University
Human olfactory system • a large number of olfactory cells (10 million) but only a small number of sensitivity classes (30) • a mixture of volatile compounds results in a signal pattern to the brain via the mitral cells (10 thousand) • the brain interprets the signal pattern as a specific odour
sensor chamber(s) computer pattern pre- odour information chemical sensors processing recognition Electronic nose concept • sensitivity to many compounds using a limited number of chemical sensors with different and partly overlapping selectivity profiles • analyse the sensor signal pattern rather than the individual signals • gives a description of the total measurement state, i.e. the sum of all components, which can be more important than a detailed knowledge of each of the individual components
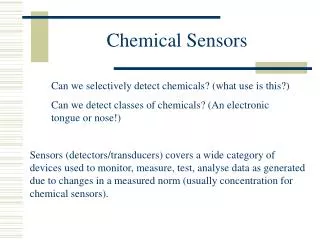
Background; The Tongue • Based on voltammetry • Currents are measured as a function of applied potential on electrode surfaces • The currents are caused by: • Redox reactions at the surface • Ionic movement in the sample
Background; Voltammetry The currents are sampled once every [ms] 56.000 variables
Information overflow • An electronic nose or tongue generates large data series(one measurement can consist of up to 56.000 variabler Linköping’s telephone book) • Impossible to get a good grip of these numbers • We need to decrease the information content • A lot of redundant information means that compression is possible
Other possible problems • Noise • Drift • Low sensitivity • Sampling problems • Measurements system • …
What is drift? • Definition: “a gradual change in any quantitative characteristic that is supposed to remain constant” (Webster’s Seventh New Collegiate Dictionary) • For chemical sensors:Measurements made under identical chemical conditions give different sensor responses at different times.
Causes of drift • Reactions on the sensor surface (poisoning) • changes in the physical properties of the sensing material (e.g. the size of the metal islands on a MOSFET) • adsorption of species on the sensor surface • layer formation of reaction products • Variations in the gas (composition, pressure, temperature,…) • Remaining gas in the measurement system
Example of drift • Measurements made during 60 days on nine different mixtures of four gases • Gradual change + jumps • Drift + noise • Drift in different directions for the different sensors • Below are shown the responses of three sensors as a function of time
Comparison noise and drift • Drift • low frequency • caused by changes in the measurement system • similar for similar sensors • Noise • high frequency • caused by randomness in the measurements • individual for each sensor
sensor chamber(s) computer pattern pre- odour information chemical sensors processing recognition What do we do? • Pre-processing to compensate for some of the problems mentioned previously • Pattern recognition models to give the desired information • If possible, give feedback regarding the measurements
Geometrical interpretation 1,2,3-variables 56.000 variables ? Easy to visualise Abstract Reduce the number of dimensions Often made by choosing directions with a lot of variation
Principal Component Analysis Can be used for data compression, feature extraction, or visualisation
Examples of pre-processing • 1st example uses PCA to find a direction where irrelevant information is dominant. This direction is then removed from the data set. • 2nd example shows how wavelets are used to compress data, and how the choice of wavelets depends on the application.
Component correction • Uses a reference gas • Calculates the direction of drift by PCA for the reference gas • Removes this direction(s) from all other measurements • Example: Artursson et al. J. of Chemometr. 14, 5/6 (2000) 711-724
Component correction • 1st (or several) component in a PCA analysis of the reference gas will describe the drift direction, p • Project the samples, X, on the first loading, p from the PCA on the reference gas, • t=Xp • Subtract the bilinear expression, tpT, from X • Xcorrected=X- tpT
before component correction Component correction • Also used for quantification
Wavelets • Data is described using wavelet base functions with different scales • The number of wavelets = the number of original variables
Wavelet selection • By selecting only the most relevant wavelets, a data reduction is obtained • Different criteria for selection in different applications (e.g. variance or discrimination) • Here approximately 100 wavelets are chosen from the original ca. 1800-14000 variables
Reconstruction • The original signal can be reconstructed from the compressed data • Different results from different wavelet selection criteria Variance selected Discrimination selected
sensor chamber(s) computer pattern pre- odour information chemical sensors processing recognition Pattern recognition • After reducing initial obstacles with different pre-processing techniques, a model that gives the user something he/she can understand must be made
Data models • Classification or quantification? • Statistical tools for class membership
Data models • Quantification of gases or liquids: • Regression models (e.g. PLS) for linear relationships • Artificial neural networks (ANN) for non-linear black-box modeling • Important always to validate data, especially when many parameters are used in the models!!!