Turbulence Observations in Tidal Zones and Soliton Surges: Insights from Oceanic Profiles
90 likes | 182 Vues
This study examines turbulence in tidal areas, including observations of soliton surges and internal waves in different oceanic regions. Data from measurements made by automated profiling systems reveal energetic solitons and internal tides, offering insights into wave evolution and barotropic tidal amplitudes. The findings shed light on the complex dynamics of oceanic processes at various depths and locations.

Turbulence Observations in Tidal Zones and Soliton Surges: Insights from Oceanic Profiles
E N D
Presentation Transcript
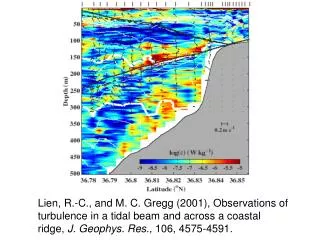
Lien, R.-C., and M. C. Gregg (2001), Observations of turbulence in a tidal beam and across a coastal ridge, J. Geophys. Res., 106, 4575-4591.
http://www.es.flinders.edu.au/~mattom/IntroOc/notes/figures/fig10a7.htmlhttp://www.es.flinders.edu.au/~mattom/IntroOc/notes/figures/fig10a7.html
Space Shuttle Flight 41G; 36N, 5.5W, 12:04:04 GMT, 11 Oct 1984 Overview of a soliton surge through the Strait of Gibraltar into the Alboran Sea. Once a day the high tide produces sufficient energy to create solitons atop the strong density boundary between the dense bottom water flowing west into the Atlantic Ocean and the less dense water flowing into the Mediterranean from the Atlantic.
Observation of the upper ocean near the shelf break off northern Oregon made from FLIP in Oct. 1995. >18000 profiles of T, S, and thermal and kinetic energy dissipation rates were measured by an automated Loose-tethered Microstructure Profiler every 80 s. Energetic solitons generated near the shelf break propagated shoreward past FLIP, which was tri-moored in 150m of water. Extremely nonlinear solitons, with downward displacements of 25m from a 7m pycnocline depth were observed on the leading edge of the semidiurnal internal tide.
S07-05-245 Flight STS-7; 18.5N, 111.5E, 23 June 1983 4 sets of such internal waves observed by the Challenger's crew as they orbited over Hainan Island and the South China Sea. The waves, each representing a high tide of the diurnal tidal cycle.
Stack plot of T at mooring S7 on the 350 m isobath. The bottom 150 m are not shown to allow a clearer presentation of the internal wave structure. Each panel is one day (May 4 – 14, 2001) from 0000 to 2400 hours. Ramp et al., 2003
120 m ASIAEX Temperature May 6, 2001 Wave Evolution Towards Shallower Water 200 m N E W S 350 m 120 S4 200 S5 °C wave 350 S7 Ramp et al., 2003 Hours on May 6 (GMT)
T and w (top panel), and u (bottom panel) for the May 8 soliton packet observed at ASIAEX mooring S7 on the 350 m isobath. w, white line, was sampled by the 90-m ADCP range cell, one of the closest bins to the transducer heads. The upper layer horizontal velocities are from the ADCP and the lower layer velocities are from the three Aanderaa current meters. Ramp et al., 2003
Ramp et al., 2003 Observed and PCTides-generated barotropic tidal amplitudes at S7 on the Chinese continental slope. Middle: The barotropic tidal height in Luzon Strait, as computed by the global tidal model PCTides. Top: T at 140 m at site S7 on the 350 m isobath, phase-shifted 3.7 days to the left (earlier) to account for the propagation time between the proposed generation site (Luzon Strait) and the mooring. All the pressure time series had the mean removed, were scaled up by a factor of 10, and were offset by 15 and 30 db, respectively for clarity.