Download
1 / 27
270 likes | 386 Vues
Impacts of Media Coverage of Coastal Weather Events on Attendance Levels at Northern Gulf State Parks. By Kimberly L. Morgan CNREP 2010, New Orleans, LA 27 May 2010. PROBLEM.

E N D
Impacts of Media Coverage of Coastal Weather Events on Attendance Levels at Northern Gulf State Parks By Kimberly L. Morgan CNREP 2010, New Orleans, LA 27 May 2010
PROBLEM • Recreational park location and amenities, weather conditions, water quality, temperature, wind, and seasonality were expected to impact the daily fees collected by public parks that are used to support these taxpayer-funded facilities.
PROBLEM • Numerous anecdotal reports have attributed the publication of numerous press articles and widespread media attention concerning coastal weather events as a primary contributing factor in reducing demand for coastal recreational activities, regardless of the actual environmental conditions at a specific site.
OBJECTIVE • To estimate the impact of adverse weather events and media coverage of adverse weather on attendance at publicly funded recreational facilities.
BACKGROUND • Media coverage of FL red tides has significant impact on park attendance at Gulf Coast Florida park (Morgan et al., in review, 2010) • Tourists to resident park visitors ratio averages 50/50 in FL state parks – up to 90% tourists in-season! (pers. comm., Michael Hensley, 020209)
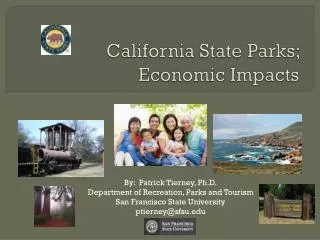
BACKGROUND • Know expenditures by out-of-state visitors to state parks have positive economic impact on NC, SC, TN & GA (Bergstrom et al., 1990) • “…the economic impact of parkland use and the value placed on it by society is large and underreported.” (Eagles, McLean & Stabler, 2000)
BACKGROUND • Econometric model of annual SW national park visitation revealed that fire & drought resulted in statistically significant reductions in attendance levels by 21% and 7%, respectively (Matzarakis, de Freitas & Scott 2007) • “…a fundamental driver of tourism climatology is the identification & evaluation of environmental information for business planning & decision-making in the recreation and tourism industry (de Freitas 2003)
BACKGROUND • The decline in per capita visits to US national parks since 1988 was found to be significantly correlated with several electronic entertainment indicators…hours of television, movie attendance, video games and internet use (Pergams & Zaradic, 2006) • “… the media in general have a primary influence in destination image formation.” (Govers, Go & Kumar, 2007)
STUDY REGIONS PENSACOLA, FLORIDA AREA • Tarkiln Bayou • Perdido Key • Big Lagoon 1 3 2
STUDY REGIONS GREATER NEW ORLEANS, LOUISIANA • St. Bernard • Bayou Signette • Grand Isle (re-opened 01 May 2009 after Gustav) 1 2 3
DATA • Monthly visitor data were collected July 2001 through September 2008 • Park attendance was measured as number of vehicles that paid admission fees (managers estimate an average ~ 2 persons per car)
AVERAGE NUMBER OF PARK VISITORS, BY MONTH, 2001-08, GREATER NEW ORLEANS, LA
AVERAGE NUMBER OF PARK VISITORS, BY YEAR, 2001-08, GREATER NEW ORLEANS, LA morgan@agecon.msstate.edu
DATA • Weather events that resulted in financial property damages (Sources: National Climatic Data Center stations at Pensacola, FL and New Orleans, LA international airports) • Flash floods, coastal floods, hail, heavy surf, high winds, hurricane, lightning, storm surge, thunderstorm, tornado & tropical storm winds hurricane moran@agecon.msstate.edu
DATA Average monthly temperature & precipitation Greater New Orleans, LA
DATA • News articles were collected using NewsLibrary.com • Keyword phrases: “hurricane and state park” & “storm and tourism and state park”. • Articles that included these phrases during each month for 5-6 local newspapers per study area were noted
ANALYSIS • A multiple regression model was estimated for each of the two study regions to assess the relationships between weather events and media publications on monthly park attendance. • Monthly and annual dummies included to account for seasonal visitation trends (base set to December 2001).
FINDINGS Greater New Orleans, Louisiana • Overall, explained 82% of the variation in monthly attendance levels recorded by park managers • Only a weak negative relationship between weather events and park visitation, though not statistically significant
FINDINGS Greater New Orleans, Louisiana • Explained 82% of the variation in monthly attendance levels recorded by park managers • Negative and statistically significant decline in average monthly attendance -> when keywords appeared in newspapers at least once monthly • Decrease of 5,761 visitors, representing approximately $103,698 in lost annual revenues across 3 parks
FINDINGS Pensacola, Florida • Explain 75% of the variation in monthly attendance levels recorded by park managers • Only a weak negative and statistically insignificant decline in average monthly attendance when keywords appeared in newspapers
FINDINGS Pensacola, Florida • Explain 75% of the variation in monthly attendance levels recorded by park managers • Negative and statistically significant relationship between adverse weather events and park visitation • 4,659 fewer visitors per month when extreme weather occurred, represents approximately $83,862 in lost annual revenues
RELEVANCE • Improve decision-maker awareness of media messages which significantly impact recreational attendance levels linked to adverse weather events • Local news mattered in NO region, actual weather mattered in FL Panhandle • NO relatively more local visitors vs FL out-of-state? • Trip planning timeframe – spur of the moment vs Spring Break? • Alternative recreational options? • Park characteristics/amenities?
RELEVANCE • Interviews of state park managers… • Park attendance? • Special events • Economy • Fishing regulations • Park expenditures? • Labor > 50% • Insurance < 20% • Facilities > 30% • Advertising < 1%
FUTURE WORK • Estimate media and adverse weather impacts on additional coastal recreation facilities • Stratify media coverage by capital (natural, built, human, social) type • Estimate indirect revenue losses to study regions resulting from both media coverage and weather events
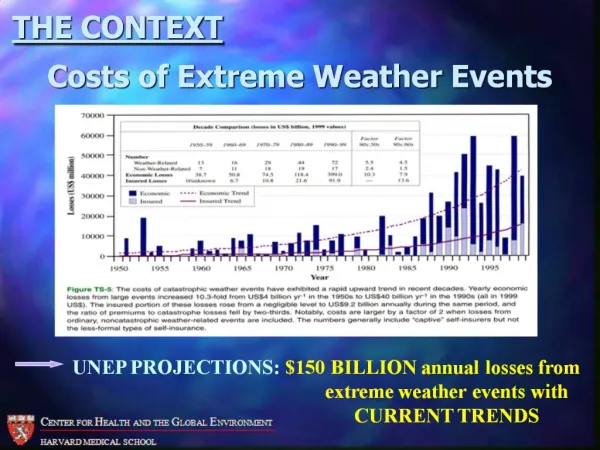
In a time of extraordinary human effort to control the natural world, the global toll from extreme events of nature is increasing…It may well be that the ways in which mankind deploys its resources and technology in attempts to cope with extreme events of nature are inducing greater rather than less damage and that the process of rapid social change work in their own way to place more people at risk and make them more vulnerable. ‘…' To sum up, the global toll of natural disaster rises at least as fast as the increase in population and material wealth, and probably faster.” Burton et al. (1978, pp. 1&2)
Thank you! morgan@agecon.msstate.edu questions?