Download
1 / 49
490 likes | 664 Vues
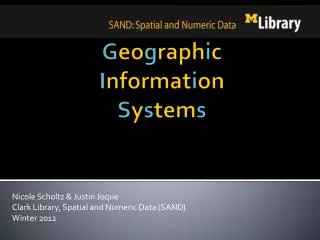
Nicole Scholtz & Justin Joque Clark Library, Spatial and Numeric Data (SAND) Winter 2012. G eo g raph i c I nformat i on S y s tem s. GIS and Spatial Data. Background Exercise Introduction to Data More Exercise Conclusion. What exactly is GIS?. Geographic Information Systems

E N D
Nicole Scholtz & Justin Joque Clark Library, Spatial and Numeric Data (SAND) Winter 2012 GeographicInformationSystems
GIS and Spatial Data • Background • Exercise • Introduction to Data • More Exercise • Conclusion
What exactly is GIS? • Geographic Information Systems • A GIS is a database management system that can store, organize, display, and analyze geospatial data • A computer-assisted information system to collect, store, manipulate and display spatial within the context of an organization, with the purpose of functioning as a decision support system. • Not Global Positioning Systems (GPS)
“It’s not something you would see until you actually saw it.”
“It’s not something you would see until you actually saw it.”
Anthropology, Sociology, Linguistics What is your generic term for a sweetened carbonated beverage? a. soda (52.97%) b. pop (25.08%) c. coke (12.38%) d. tonic (0.67%) e. soft drink (5.89%) f. lemonade (0.01%) g. cocacola(0.29%) h. fizzy drink (0.14%)i. dope (0.03%) j. other (2.55%) (10,669 respondents)
soda pop coke
Smith College, Students and Space • Please write the letter (A, B, C, etc) in the area on the map that corresponds with your answer. • A is where I usually go to hang out with my friends. • B is where I often like to go to study. • C is the area I spend most of my time when I spend time outdoors. • D is the area or building that I generally like to show friends and family when they come to visit the campus. • E is the building or the area that most of the incidences involving public safety occur. • F is where I go to find a quiet area to be in outside of my dorm or residence. • G is where I go when I want a snack outside of my dorm or residence. • H is where I usually go to exercise. • I is where I feel least safe on-campus. • J is my favorite building on-campus.
Basic GIS Questions Location: What is at…? Trends: What has changed…? Condition: Where is the location that meets these criteria? Pattern: What is the spatial pattern or distribution…? Modeling: What if…? Best GIS questions are the ones you hadn’t thought of until you looked at the maps …
Visualizing vs. Analyzing display organize analyze
GIS • There are many different GIS systems out there, ArcGIS Desktop is just one • Components of ArcGIS Desktop– • ArcCatalog • ArcMap • ArcScene • ArcGlobe! • Arc View 3.x still works, still being used.
Web mapping options • Google Maps, Google Earth • American Factfinder (the Census) • You name it, it might have a web mapping tool • Where else do you map?
Why would a researcher come to use GIS? • Frequently material already has a spatial component – use GIS to organize, display and analyze spatial data • Great technology for projects that are interdisciplinary, multi-disciplinary and collaborative
…and for students • Marketable skill that can expand work or grad school opportunities regardless of academic background. (SAND participates in the Certificate for Spatial Analysis at UM)
Exercise • Imagine that you are a researcher interested in the effect that parks and greenspaces have on children living near them in a city with a generally large number of parks. We will determine where parks and greenspaces are, and what proportion of each census block’s population is children under the age of 17. • See handout
Driven by Data • Watch demo
Geographic file formats • More common formats: • File Geodatabase - ESRI's geodatabase format, stored as folders in a file system. • Shapefile - ESRI's open, hybrid vector data format using SHP, SHX and DBF files • DXF - Contour elevation plots in AutoCAD DXF format • Personal Geodatabase - ESRI's closed, integrated vector data storage strategy using Microsoft's AccessMDB format • Other things you might encounter: • MapInfo TAB format - MapInfo's vector data format using TAB, DAT, ID and MAP files • Geography Markup Language (GML) - XML based open standard (by OpenGIS) for GIS data exchange • Simple Features - Open Geospatial Consortium specification for vector data • National Transfer Format (NTF) - National Transfer Format (mostly used by the UK Ordnance Survey) • TIGER - Topologically Integrated Geographic Encoding and Referencing • Cartesian coordinate system (XYZ) - Simple point cloud • Vector Product Format - National Imagery and Mapping Agency (NIMA)'s format of vectored data for large geographic databases. • GeoMedia - Intergraph's MicrosoftAccess based format for spatial vector storage. • ISFC - Intergraph's MicroStation based CAD solution attaching vector elements to a relational MicrosoftAccess database • Coverage - ESRI's closed, hybrid vector data storage strategy. Legacy ArcGIS Workstation / ArcInfo format with reduced support in ArcGIS Desktop lineup
Shapefiles: Mandatory files • .shp— shape format; the feature geometry itself • .shx — shape index format; a positional index of the feature geometry to allow seeking forwards and backwards quickly • .dbf — attribute format; columnar attributes for each shape, in dBase III format (taken from Wikipedia article on shapefiles)
Shapefiles: Nonmandatory files • .prj— projection format; the coordinate system and projection information, a plain text file describing the projection using well-known text format • .sbn and .sbx— a spatial index of the features • .shp.xml— metadata in XML format • .fbn and .fbx — a spatial index of the features for shapefiles that are read-only • .ain and .aih — an attribute index of the active fields in a table or a theme's attribute table • .ixs — a geocoding index for read-write shapefiles • .mxs — a geocoding index for read-write shapefiles (ODB format) • .atx — an attribute index for the .dbf file in the form of shapefile.columnname.atx (ArcGIS 8 and later) • .cpg — used to specify the code page (only for .dbf) for identifying the characterset to be used • (taken from Wikipedia article on shapefiles)
Maps are not data So what is a map? • mxd – map file • Relative paths! Specify before you start • Doesn’t store your data, just points to it • Your canvas • .lyr – layer file • Like a mini map file that corresponds to one data file only • Stores how you want a particular data file to display: colors, labels, etc.
Raster data • Many many formats. Top 4 are most common • GeoTIFF - TIFF variant enriched with GIS relevant metadata • IMG - ERDAS IMAGINE image file format • ESRI grid - binary and ASCII raster formats used by ESRI • MrSID - Multi-Resolution Seamless Image Database (by Lizardtech). A compressed wavelet format, often lossy. • JPEG2000 - Open-source raster format. A compressed format, allows both lossy and lossless compression. • ADRG - National Imagery and Mapping Agency (NIMA)'s ARC Digitized Raster Graphics • CADRG - National Imagery and Mapping Agency (NIMA)'s Compressed ARC Digitised Raster Graphics (nominal compression of 55:1 over ADRG) • CIB - National Imagery and Mapping Agency (NIMA)'s Controlled Image Base (type of Raster Product Format) • ECW - Enhanced Compressed Wavelet (from ERMapper). A compressed wavelet format, often lossy. • Digital raster graphic (DRG) - digital scan of a paper USGStopographic map
Projection • The Earth is 3D • Our usual ways of representing things on the earth are 2D • Projection is how we choose to flatten the area in which we are interested
Geographic and Planar Coordinate Systems Flat Map Cartesian coordinates: x,y Curved Earth Geographic coordinates: f, l (Latitude & Longitude)
Map Projections http://visual.merriam-webster.com/images/earth/geography/cartography/map-projections.jpg
State Plane Systems This "system" is actually a set of more than 100 different coordinate systems using different projections. With the exception of Alaska Zone 1, the projections are either Transverse Mercator or Lambert Conformal Conic (LCC). Each state consists of one or more zones. The boundaries of these zones always follow State lines and usually follow County lines. In States with multiple zones, the user can generally guess at the correct zone based on zone description and known location of the data within a state. When in doubt, a USGS topo map of the mapping area will list the appropriate State Plane Zone for the area, in the lower-left-hand-corner of the topo map
Scale • Large scale is a small area • Small scale is a large area • So: 1:1 – large scale • 1:1,000,000 – small scale • Way to remember: think of it as a fraction • The smaller the scale, the less detail
Map Projection • Oblate spheroid • To a cylinder • Flattened • Transformation of Geographic Coordinates to Plane Coordinates • Perspective is critical • Purpose is also critical • Area, scale, distance, bearing – you can have some but not all
Preserving Properties • Area – equal-area, equivalent, authalic • Shape – conformal or orthomorphic • Direction – azimuthal • Distance – equidistant • Shortest path – gnomonic (great circles)
Map Projections Equal Area Cylindrical
Map Projections Equal Area: Gall, aka “Peters” Projection
When Projection Matters • As a person new to GIS, you should look out for • Whether your layers for the same location line up with one another in space • Whether your scale bars are representing a reasonable unit • You can for the time being ignore errors that refer to things like “datum conflicts" and "geographic transformations" and "geographic coordinate systems" and "projected coordinate systems“ • As you start to do more analysis, and you care about distances, areas, distributions • You will need to take much more care with projection • If you are exporting to CAD • You need to be certain all of your layers are in the same projection, and that they are using a linear unit (feet, meters) and NOT using Decimal Degrees for a unit
Exercise • See handout • Continue where you left off earlier
Data • Do I need to make all of my data? • Probably not. • Do I need to make any of my data? • Possibly not. • Where do I find data? • Great question!
Sources: Regional, State, Local • MiGDL, other state data libraries/clearinghouses • Regional entities, e.g. SEMCOG • Great Lakes Information Network • http://gis.glin.net/ • NRSC pages for states are pretty good (google NRSC statename GIS) • Other local data – • UM Data at SAND • ESRI data set on server in the labs and in Docs • Data from SEMCOG, Washtenaw, Ann Arbor
Sources: National, International • Geodata.gov • National Map (www.nationalmap.gov) • Federal agencies – check FEDSTATS – fedstat.gov • USGS, NOAA • http://seamless.usgs.gov/ • http://www.gis.ssd.nesdis.noaa.gov/ • EPA • ESRI data for country outlines • International data: depends on the country
Sources: Census and other data • Documents Center – Census experts on hand, census data products • Map Library • ICPSR – Social science data sets • Rumsey – digitized maps
Sources of Elevation Data • USGS DEM - The USGS' Digital Elevation Model • DTED - National Imagery and Mapping Agency (NIMA)'s Digital Terrain Elevation Data • GTOPO30 - Large complete Earth elevation model at 30 arc seconds • SDTS - The USGS' successor to DEM
GIS: Keep in Mind • Just a suite of technological tools -- not a cure-all! • Steep learning curve initally – can require significant commitment of time to learn software well and reach the analysis stage • Can require a change in data collection, grain, research design • Costs: Investment of money (hardware, software, data, training) and time • Garbage In, Garbage Out
UM GIS Environment: Resources for Learning More • Locations • SAND (Spatial and Numeric Data Services) • CSCAR • http://www.umich.edu/~cscar/gis/links.html • ESALab at SNRE • Classes • Certificate for Spatial Analysis • CSCAR
Learning Online • See http://guides.lib.umich.edu/learnarcgis • Tutorials available online • Self-paced • It really helps to learn the software with canned data • Then move on to projects where you will be finding wild data, or working on developing your own data
Units Teaching GIS or related topics • School of Natural Resources and the Environment • School of Social Work • Taubman College of Architecture + Urban Planning • Engineering • AOSS (Atmospheric, Oceanic and Space Science) • School of Information • School of Public Health • Geography (LS&A) • Geology (LS&A)
UM GIS – learning more! • UP 406 / GEOG 406 Introduction to Geographic Information Systems (3 Credits) • NRE 531 Principles of GIS • Also self-study ESRI courses are available – see Resources for Learning More GIS at http://guides.lib.umich.edu/learnarcgis Advanced Spatial Statistics Intermediate GIS Intro to GIS Please fill out the brief evaluation, linked from the CTools site. Thanks! This workshop