Enhancing Education with EarthScope Data
Explore the educational potential of EarthScope data, resources for classroom use, and the impact of scientific discoveries. Engage students in seismic activities and understand the Earth's dynamics through animations and visualizations.

Enhancing Education with EarthScope Data
E N D
Presentation Transcript
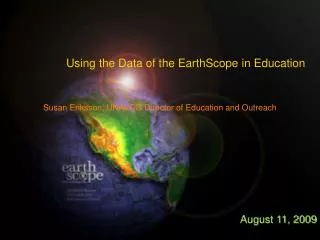
Using the Data of the EarthScope in Education Susan Eriksson, UNAVCO Director of Education and Outreach August 11, 2009
Approach for today • Purpose • What types of data for EarthScope components • What will you use it for? • Resources for data • Resources for educational framework • Plan for after the workshop
Why EarthScope? • Scientific discoveries - the ‘content’ • things we know • things we don’t know • How we go about ‘finding out’ • Skills of science -? • Exploration - inquiry
Drillhole across San Andreas Fault 875 GPS Instruments 175 Borehole Strainmeters 5 Long-Baseline Laser Strainmeters 400 Seismometers at 2,000 sites 100 Permanent Seismometers
SAFOD A borehole laboratory on the San Andreas fault studying the physics of earthquake nucleation at the depths where earthquakes begin
US Transportable Array • Includes 400 Transportable Seismometers • Station occupies a site for 1½ - 2 years • 10 years to leap-frog array across the US
Special Events 1.1.7 Special Events 2008 Wells, Nevada Earthquake Web fact sheet Teachable moment Powerpoint for faculty use Ground motion visualization: Blue down Red up Charles Ammon, Penn State
Community Products TA visualization from Chuck Ammon Uses Workshops Presentations Web Automatically generated version available from IRIS DMC Plans Matlab version Special events version for public and media Community Products
PBO 11
Plate Motion 12
Transient motion associated with faults Episodic Tremor and Slip Parkfield Earthquake 15
Cascadia Interpretive Workshop Cascadia Subduction Zone We can see what’s on the surface. How does the surface change as a response to subduction? How does EarthScope help us appreciate earthquakes, tsunamis, and volcanic eruptions?
Animations Developing series to explain EarthScope-related concepts Episodic tremor and slip Animations
Animations Animations • Developing series to explain EarthScope-related concepts • Episodic tremor and slip
ETS Progression over days http://www.pnsn.org/WEBICORDER/DEEPTREM/fall2006.html 20 Trem_movie_2008eq_time.mov
Propagation of Sumatra Earthquake http://www.seismology.harvard.edu/~ishii/sumatra/index.html Ishii 2005 22
Volcanic Deformation Volcanic Signals Sierra Negra, Galapagos Time Dennis Geist, U. Idaho 24
Galapagos InSAR and GPS Vectors Showing trapdoor faulting event
Yellowstone Ground Motions Fig. 2. (A) Temporal variation of vertical ground motions of labeled Yellowstone GPS stations 26 26 W.-L. Chang et al., Science 318, 952 -956 (2007)