Download
1 / 1
10 likes | 151 Vues
Seasonal Prediction with CCSM3.0: Impact of Land Surface Initialization James L. KINTER III 1 , Daniel A. Paolino 1 , David M. Straus 1,2 , Benjamin P. Kirtman 3 , and Dughong Min 3

E N D
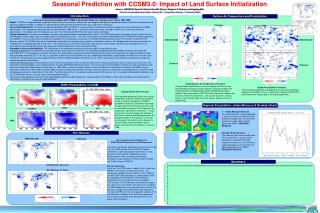
Seasonal Prediction with CCSM3.0: Impact of Land Surface Initialization James L. KINTER III1, Daniel A. Paolino1, David M. Straus1,2, Benjamin P. Kirtman3, and Dughong Min3 1Center for Ocean-Land-Atmosphere Studies, Calverton, MD // 2 George Mason University // 3 University of Miami Introduction Surface Air Temperature and Precipitation One-year re-forecast ensembles with CCSM3.0 using initial states for 1 January and 1 July in 1981-1998. Model: CCSM3 is a coupled climate model with state-of-the-art formulations of dynamics and subgrid-scale physical parameterizations, in both the atmospheric and oceanic component models. CCSM3.0 at T85 horizontal resolution with 26 vertical levels was used in the re-forecasts. Re-forecast Experiments: To assess the potential predictive skill of CCSM3.0, a large sample of retrospective forecast experiments were compared to available observations. The retrospective forecasts cover the period 1982–1998 for the 1 July initial state experiments, and 1981-1998 for the 1 January initial state experiments. Ensembles of 6 (10) hindcasts were run in the OCN-only (ATM-OCN-LND) experiments (see below). Ocean Initialization: The ocean initialization uses data assimilation products made available by GFDL. The GFDL ocean data assimilation system is based on the MOM3 global ocean model using a variational optimal interpolation scheme . The GFDL ocean initial states were interpolated to the POP grid (the ocean component of CCSM3.0). The two restart files have different resolutions in the horizontal and vertical. The MOM3 meridional domain covers 75°S to 65°N, while the POP domain is global. The MOM3 fields were interpolated horizontally and vertically using a bi-linear interpolation scheme. Climatological data from long simulations of CCSM3 were used poleward of 65°N and 75°S. The surface pressure for POP is estimated using the sea surface height and the pressure gradient terms are estimated using centered differencing. The ocean initial state is identical for each ensemble member. Atmosphere and Land Initialization: The initialization of the atmosphere and land surface was done in two different ways. OCN-only Experiment: The atmospheric and land surface initial states were taken from an extended atmosphere/land-only (CAM3) simulation with observed, prescribed SST. The atmospheric ensemble members were obtained by resetting the model calendar back one week and integrating the model forward one week with prescribed observed SST. In this way, it is possible to generate initial conditions that are synoptically independent (separated by one week) but have the same initial date. This procedure was also used by Kirtman (2003) for ENSO prediction and Kirtman et al. (2001) to generate a 100-member ensemble for atmospheric seasonal prediction experiments. ATM-OCN-LND Experiment: Initial conditions for the land and atmosphere were created for each of the 10 days preceding the date of each ocean initial state. The atmospheric initial conditions were interpolated from the daily NCEP/NCAR Reanalysis data. The land surface initial conditions (temperature and soil wetness) were taken from daily Global Soil Wetness Project data for 1986-1995, and from the daily European Centre for Medium-range Weather Forecasts (ECMWF) 40-year Reanalysis (ERA40) for 1982-1985 and 1996-1998. Anomalies of observed soil data from their respective long-term means were superimposed on a long-term CLM climatology to create the initial states for the CLM. The initial dates of the 10 ensemble members were 22-30 June for the 1 July ocean initial condition forecasts, and 22-31 December for the 1 January ocean initial condition forecasts. The sea-ice initial conditions were set to the climatological monthly condition based on a long simulation of CCSM3.0 in both sets of hindcasts. No observational information is included in the sea-ice initial conditions. January February ATM-OCN-LND ATM-OCN-LND OCN-only OCN-only Global Surface Air Temperature Forecasts The correlation coefficient of surface air temperature for January initial conditions forecasts and an objective analysis based on the Climate Analysis and Monitoring System (CAMS) observations network. Top row of panels: ATM-OCN-LND experiment. Bottom row of panels: OCN-only experiment. Left column of panels: January mean (1-month lead). Right column of panels: February mean (2-month lead). ENSO Predictability in CCSM Global Precipitation Forecasts The correlation coefficient of precipitation for July initial conditions forecasts and CMAP in July (1-month lead). Top panel: ATM-OCN-LND experiment. Bottom panel: OCN-only experiment. Tropical Pacific SST Forecast Time-longitude equatorial Pacific sea surface temperature anomaly (SSTA) cross-sections for the ensemble average of 6 CCSM3.0 ensemble re-forecasts (left column of panels), the observed (center column of panels), and an ensemble average of CFS re-forecasts for comparison (right column of panels). In each panel, time runs up the page (the ordinate is lead-time in months) and longitude across the equatorial Pacific is the abscissa. In this top row of panels, the lead-time zero forecast is January 1983, and in the bottom row of panels, the lead-time zero forecast is January 1988. 1983 Regional Precipitation: Indian Monsoon & Nordeste Brazil OISST CFS CCSM3.0 Indian Monsoon Forecast The July-September mean precipitation in south Asia from the ATM-OCN-LND experiment (upper left), the OCN-only experiment (upper right) and the observed (CMAP). DESCRIBE RESULTS Nordeste Brazil Forecast The February-April mean rainfall index for the cases with 1 January initial conditions in the ATM-OCN-LND experiment (red curve), the OCN-only experiment (blue curve) and from the observed (black curve, CMAP). DESCRIBE RESULTS. 1988 Soil Wetness ATM-OCN-LND OCN-only July (1-month lead) Soil Moisture in ATM-OCN-LND Experiment vs OCN Experiment Top panels: Correlation coefficient of soil moisture in top 9 cm of CCSM and top 7 cm of ERA-40. Positive correlations in blue and negative correlations in red, contours at 95% and 99% significance levels. Bottom panels: Same as top panel except for correlation of soil moisture in 9-29 cm layer of CCSM and 7-28 cm layer of ERA-40. Note on climatology Top 9 cm: The CCSM mean is about 30-40% drier than ERA40 in first month, for both experiments. The interannual variability of soil moisture in the CCSM for the ATM-OCN-LND experiment is comparable to ERA-40, although somewhat smaller. The OCN-only experiment has very small interannual variability. 9-29 cm layer: The CCSM mean soil moisture is about 20% drier for the first month. The interannual variability of CCSM displays the same characteristics as the in the top 9 cm, except that the ATM-OCN-LND experiment are closer to ERA-40 in terms of absolute variance. The extremely low variability of the OCN-only experiment may be due to using the same default soil IC for all cases and all members. Summary Soil Moisture Top Layer Summary Text aaaaaaaaaaaaaaaaaaaaaaaaaaaaaaaaaaaaaaaaaaaaaaaaaaaaaaaaaaaaaaaaaaaaaaaaaaaaaaaaaaaaaaaaaaaaaaaaaaaaaaaaaaaaaaaaaaaaaaaaaaaaaaaaa A A A A A A A A A A A A A A A A A Soil Moisture 2nd Layer Center for Ocean-Land-Atmosphere studies