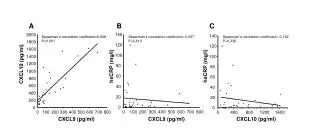
Spearman’s Rank Correlation
801 likes | 6.09k Vues
Spearman’s Rank Correlation. Spearman’s rank correlation coefficient is a statistical measure to show the strength of a relationship between two variables. Ten is the minimum number needed in a sample for the spearman’s rank test to be valid. We now know that the sum of d squared is 294.

Spearman’s Rank Correlation
E N D
Presentation Transcript
Spearman’s Rank Correlation Spearman’s rank correlation coefficient is a statistical measure to show the strength of a relationship between two variables. Ten is the minimum number needed in a sample for the spearman’s rank test to be valid.
We now know that the sum of d squared is 294 n represents the number in the sample – In this case 10
Your answer should always be between -1 and 1. In this example, there is a strong negative correlation between altitude and temperature. This means that as the altitude increases the temperature falls.
Although the closer to r (your answer) is to +1 or -1 the stronger the likely correlation, there is a danger of jumping to quick conclusions. It is possible the relationship identified has occurred by chance. We must therefore test the significance of the relationship.
r is plotted on the y axis and degrees of freedom on the x. To attain a ‘degrees of freedom’ for your answer simply subtract 2 from the total number of pairs used in your calculation e.g. As we visited 10 Sites, 10 -2 = 8. So the degrees of freedom of 8.
Standard Deviation The standard deviation measures the spread of the data about the mean value. It is useful in comparing sets of data which may have the same mean but a different range. For example, the mean of the following two is the same: 15, 15, 15, 14, 16 and 2, 7, 14, 22, 30. However, the second is clearly more spread out. If a set has a low standard deviation, the spread of the values is limited.
Example Find the standard deviation of 4, 9, 11, 12, 17, 5, 8, 12, 14 First work out the mean: 10.222 (add all numbers together and then divide by the number of numbers) Now, subtract the mean individually from each of the numbers given and square the result.
Now add up these results (this is the 'sigma' in the formula): 139.55 Divide by n. n is the number of values, so in this case is 9. This gives us: 15.51 And finally, square root this: 3.94 The higher the number the more spread out the sample.