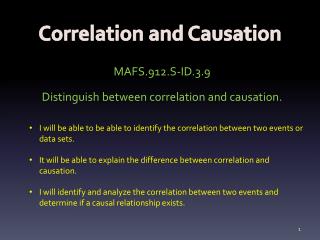
Correlation vs. Causation
Correlation vs. Causation. 64% of American’s answered “Yes” . 38% replied “No”. The other 8% were undecided. . In a Gallup poll, surveyors asked, “Do you believe correlation implies causation?’”. Correlation tells us two variables are related Types of relationship reflected in correlation

Correlation vs. Causation
E N D
Presentation Transcript
64% of American’s answered “Yes” . • 38% replied “No”. • The other 8% were undecided. In a Gallup poll, surveyors asked, “Do you believe correlation implies causation?’”
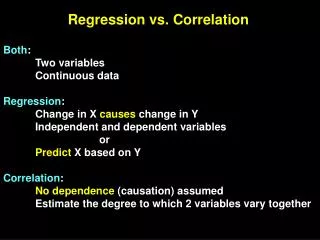
Correlation tells us two variables are related • Types of relationship reflected in correlation • X causes Y or Y causes X (causal relationship) • X and Y are caused by a third variable Z (spurious relationship) Correlation vs Causation http://www.youtube.com/watch?v=42c7FAnANdk&feature=related
‘‘The correlation between workers’ education levels and wages is strongly positive” • Does this mean education “causes” higher wages? • We don’t know for sure ! • Recall: Correlation tells us two variables are related BUT does not tell us why Correlation vs. Causation Example http://www.youtube.com/watch?v=UNonyq1yhiE
Possibility 1 • Education improves skills and skilled workers get better paying jobs • Education causes wages to • Possibility 2 • Individuals are born with quality A which is relevant for success in education and on the job • Quality (NOT education) causes wages to Correlation vs. Causation
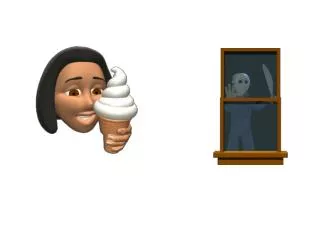
Ice-cream sales are strongly correlated with death from drowning rates. Therefore, ice-cream causes drowning.
Ice cream sales and the incidents of polio are correlated. • Skirt lengths and stock prices are highly correlated (as stock prices go up, skirt lengths get shorter). • The number of cavities in elementary school children and vocabulary size are strongly correlated (negatively) Return
Without proper interpretation, causation should not be assumed, or even implied.
The study of more than 600 normal-weight people found, eight years later, that they were 65 percent more likely to be overweight if they drank one diet soda a day than if they drank none. • And if they drank two or more diet sodas a day, they were even more likely to become overweight or obese. Consider the following research undertaken by the University of Texas Health Science Center at San Antonio appearing to show a link between consumption of diet soda and weight gain.
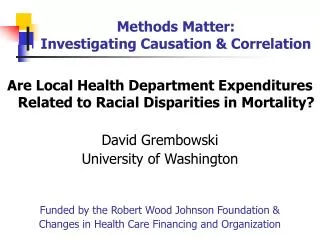
Third or Missing Variable Problem • A relationship other than causal might exist between the two variables. • It is possible that there is some other variable or factor that is causing the outcome.
A strong relationship between two variables does not always mean that changes in one variable causes changes in the other. • The relationship between two variables is often influenced by other variables which are lurking in the background. • There are two relationships which can be mistaken for causation: • Common response • Confounding
• Common response refers to the possibility that a change in a lurking variable is causing changes in both our explanatory variable and our response variable • Confounding refers to the possibility that either the change in our explanatory variable is causing changes in the response variable OR that a change in a lurking variable is causing changes in the response variable.
Both X and Y respond to changes in some unobserved variable, Z. • All three of our previous examples are examples of common response. 1. Common Response:
The effect of X on Y is indistinguishable from the effects of other explanatory variables on Y. • When studying medications, the “placebo effect” is an example of confounding. 2. Confounding
When controlled experiments are performed. When can we imply causation? Unless data have been gathered by experimental means and confounding variables have been eliminated, correlation neverimplies causation.
Kids’ TV Habits Tied to Lower IQ Scores IQ scores and TV time r = -.54
Eating Pizza ‘Cuts Cancer Risk’ Pizza consumption and cancer rate r = .-59
Gun Bill Introduced to Ward Off Crime Gun ownership and crime r = .71
Reading Fights Cavities Number of cavities in elementary school children and their vocabulary size r = -.67
Graffiti Linked to Obesity in City Dwellers BMI and amount of graffiti and litter r = .45
Stop Global Warming: Become a Pirate Average global temperature and number of pirates r = -.93
4 ways survey results are skewed Lies, damn lies, and marketing data:
Numbers don’t tell the whole truth. • Four out of five dentists recommend sugarless gum for their patients who chew gum? Prove it. Show me the data—all the data. • It’s not that numbers lie; people do—or they mislead, at least, consciously or not. • People are often wrong, inexperienced, shortsighted, and biased. • People bring unspoken agendas to the table, consciously or unconsciously—a way of looking at numbers whereby they are hoping to be proved right. • Yet, most people trust data. • We see people mindlessly sharing, tweeting, and retweeting survey and poll data, Web analytics, and infographics
The many ways data can be skewed. • Failing to determine whom you are surveying or what you are studying. • This is where it all begins. • Known as cohort selection, it’s the foundation upon which all data analysis is built. • If you get this wrong, every other aspect of your analysis is flawed. • Without a data set that is sufficiently representative of the whole (and sufficiently large enough to ensure some level of statistical certainty) your analysis will not be accurate.
2. Asking slanted questions. • On far too many occasions, researchers and pollsters ask questions that skew the results. • (Recall “Framing”) • These questions can be leading and create false assumptions or false comparisons. • There are a number of ways in which a skilled researcher can create a poll question so the results are all but a foregone conclusion.
3. Presenting data in a misleading way. • Often, researchers present data in such a way as to overemphasize the results they're seeking to communicate. • This is often done visually, while crafting the chart or graph meant to create a shortcut for data visualization. • Every time you hear that some effort increased our response rate by 50 percent, your reaction should be to know from what to what? • For instance, increasing conversion rate from 10 percent to 15 percent is quite different from increasing it from 2 percent to 3 percent. • Both represent 50 percent increases, right?
4, Implying causation where only correlation exists. • In the autumn, the oak tree sheds its leaves, and the squirrels forage for food for the coming winter. • The squirrels might take a cue when the leaves start to fall (probably not), but the falling leaves do not cause them to gather acorns. • Many times, we will see two observed phenomena linked as though one caused the other, without adequately proving the causative relationship. • When we see researchers implying causation where none exists (or where the causation has yet to be proved sufficiently), we should run the other way, never to trust their analysis again.
EXAMPLE OF RANDOM ERROR, BIAS, MISCLASSIFICATION AND CONFOUNDING IN THE SAME STUDY:
Systematic, non-random deviation of results and inferences from the truth, or processes leading to such deviation. Any trend in the collection, analysis, interpretation, publication or review of data that can lead to conclusions which are systematically different from the truth. (Dictionary of Epidemiology, 3rd ed.) Bias can be either conscious or unconscious BIAS
A problem resulting from the fact that one feature of study subjects has not been separated from a second feature, and has thus been confounded with it, producing a spurious result. The spuriousness arises from the effect of the first feature being mistakenly attributed to the second feature. CONFOUNDING
Bias creates an association that is not true, but confounding describes an association that is true, but potentially misleading. THE DIFFERENCE BETWEEN BIAS AND CONFOUNDING
STUDY: In a study, babies of women who bottle feed and women who breast feed are compared, and it is found that the incidence of gastroenteritis, as recorded in medical records, is lower in the babies who are breast-fed. EXAMPLE OF RANDOM ERROR, BIAS, MISCLASSIFICATION AND CONFOUNDING IN THE SAME STUDY:
By chance, there are more episodes of gastroenteritis in the bottle-fed group in the study sample. (When in truth breast feeding is not protective against gastroenteritis). Or, also by chance, no difference in risk was found. (When in truth breast feeding is protective against gastroenteritis). EXAMPLE OF RANDOM ERROR
Lack of good information on feeding history results in some breast-feeding mothers being randomly classified as bottle-feeding, and vice-versa. If this happens, the study underestimates either of the two groups. EXAMPLE OF MISCLASSIFICATION
The medical records of bottle-fed babies only are less complete (perhaps bottle fed babies go to the doctor less) than those of breast fed babies, and thus record fewer episodes of gastro-enteritis in them only. This is called bias because the observation itself is in error. In this case the error was not conscious. EXAMPLE OF BIAS
The mothers of breast-fed babies are of higher social class, and the babies thus have better hygiene, less crowding and perhaps other factors that protect against gastroenteritis. Less crowding and better hygiene are truly protective against gastroenteritis, but we mistakenly attribute their effects to breast feeding. This is called confounding, because the observation is correct (breast-fed babies have less gastroenteritis), but its explanation is wrong. EXAMPLE OF CONFOUNDING
http://www.youtube.com/watch?v=UNonyq1yhiE What types of data skew have you seen in your experience?