Correlation and Causation
Correlation and Causation. I will be able to be able to identify the correlation between two events or data sets. It will be able to explain the difference between correlation and causation.

Correlation and Causation
E N D
Presentation Transcript
Correlation and Causation • I will be able to be able to identify the correlation between two events or data sets. • It will be able to explain the difference between correlation and causation. • I will identify and analyze the correlation between two events and determine if a causal relationship exists. MAFS.912.S-ID.3.9 Distinguish between correlation and causation.
Why Learn • To analyze the data sets and draw proper inference. • To create logical arguments and conclusions based on data. • To analyze the validity of other individual’s conclusions.
REMEMBER The Coordinates Horizontal axis Vertical axis Variable y Range Rise Dependent variable usually the response variable • Variable x • Domain • Run • Independent variable • usually some variable we suspect may be related to the response
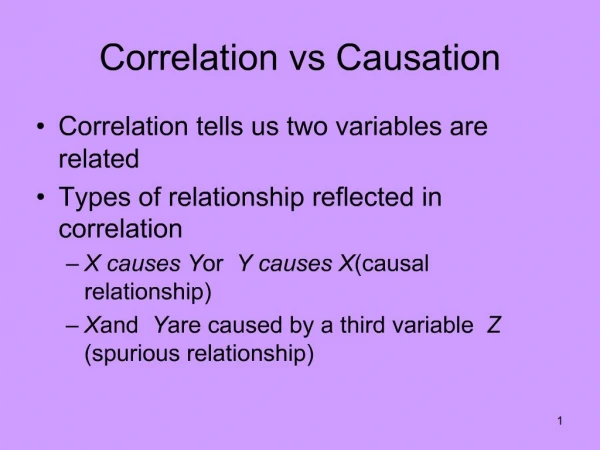
Correlation “a relation existing between phenomena or things or between mathematical or statistical variables which tend to vary, be associated, or occur together in a way not expected on the basis of chance alone” (Merrian-Webster’s online dictionary) • statistical measure that defines the direction and how close a relationship is between two or more variables does not automatically mean that the change in one variable is the cause of the change in the values of the other variable often the first step to prove connection
REMEMBER: Relationship Direct Inverse negative correlation variable change in the opposite manner line points in a left, upward or right, downward direction number increases in the x thus it decreases in the y axis number decreases in the x thus it increases in the y axis • positive correlation • both sets of data either increasing or decreasing together • line points in an right, upward or left, downward direction • number increases in the x thus if increases in the y axis • number decreases in the x thus it decreases in the y axis
TYPES OF CORRELATIONS o Understand correlation is not how steep or if theslope is positive ornegative
Perfect Positive Correlation • points slopes from lower left to upper right creating a linear • direct relationship • x value goes right y value goes up • x value goes left, y value goes down • the correlation coefficient equals 1 • points on scatterplot can be connected to make a line
Perfect Negative Correlation • points slopes from upper left to lower right creating a linear • inverse relationship • x value goes right, y value goes down • x value goes left, y value goes up • the correlation coefficient equals 1 • points on scatterplot can be connected to make a line
High Correlations • points are close together • points are close to a Line of Fit
Low Correlations • points are not scattered however not close together • points are not close to a Line of Fit
No Correlation Points are scatter to far apart Cannot create a line of best fit If there is no correlation , the coefficient is zero
REV IEW: Pearson Correlation Coefficient • The correlation coefficient is represented by the letter “r” • The value of “r” falls between -1 and 1 • A negative “r” value implies a negative correlation • A positive “r” value implies a positive correlation. • If “r” equals 0, that means there is no correlation between the variables.
Causation • A stronger correlation, more likely they are to indicate causation • This is a specific correlation because: • specific correlation where the dependent variable is the result of the independent variable event • a relation where “x” has an affect on “y” within a specific statistical range • causes a specific direct/inverse relationship on the dependent variable.