Global Labor Wages and Market Systems
240 likes | 338 Vues
Explore wage determination mechanisms, real vs. nominal wages, and labor market equilibrium in global perspective. Learn about monopsony power, union models, productivity impact on wages, and the role of minimum wage legislation.

Global Labor Wages and Market Systems
E N D
Presentation Transcript
A. Wage rateB. Nominal wageC. Real wage -- Wage rate: price paid per unit of labor services (one hour of work). * Labor earnings: multiply the wage rate by number of hours. -- Nominal wage: amount of money received per hour, day, or year. -- Real wage: quantity of goods & services a worker can obtain with nominal wages; reveals the “purchasing power” of nominal wages. Real wages – adjusted for inflation. Nominal wages – not adjusted.
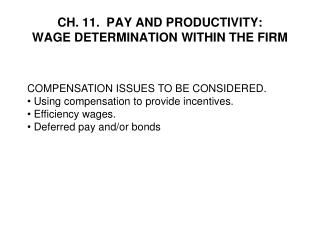
GLOBAL PERSPECTIVE Labor Wages and Earnings Hourly Wages of Production Workers Selected Nations Hourly Pay in U.S. Dollars, 2004 0 5 10 15 20 25 30 35 33.75 Denmark Germany Switzerland Sweden United Kingdom France United States Australia Japan Canada Italy Korea Taiwan Mexico 32.53 30.26 28.42 24.71 23.89 23.17 23.09 21.90 21.42 20.48 11.52 5.97 2.50 Source: U.S. Bureau of Labor Statistics, 2006
The Role of Productivity The demand for labor is high in the U.S. and other advanced economies because labor is productive due to: • Plentiful capital • Many natural resources • Advanced technology • Labor quality • Culture -- Real wages in the U.S. in the long run have increased at about the same rate as increases in output per worker. -- Increases in productivity result partly due to increased technology.
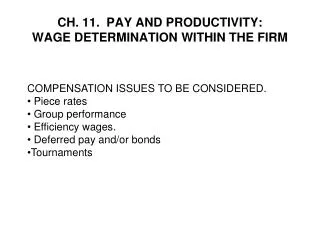
Real Wages & Productivity • There’s a close long- run relationship in the U.S. between output per week and real hourly compensation (= wages & salaries + employers’ contributions to social insurance and private benefit plans). • Graph shows increases in labor supply & labor demand, resulting in a long-run, or secular, increase in wage rates and employment.
Real Wages and Productivity • Secular Growth of Real Wages • Long Run Trend of Real Wages in the U.S. S2020 S2000 S1950 S1900 Real Wage Rate (Dollars) D2020 D2000 D1950 D1900 Quantity of Labor
Purely Competitive Labor Market1. MRP = MRC Rule Now we look at specific wage rates (from ch. 25) In this market: • Firms compete for hiring specific labor. • Qualified workers supply the labor. • Individual firms and individual workers are “wage takers” since neither can exert any control over the market wage rate. Non-labor cost (S = MRC) Total wage cost
Purely Competitive Labor Market • Market Demand for Labor • Market Supply for Labor • Labor Market Equilibrium • MRP = MRC Rule Graphically…
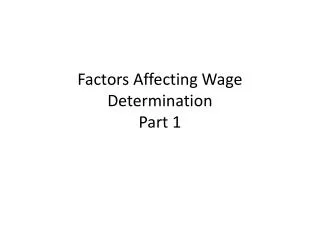
Labor supply and labor demand in a (a) purely competitive labor market and (b) a single competitive firm. Labor Market Individual Firm • PC labor market has many firms competing in hiring a specific type of labor. • Each (numerous) qualified worker w/ identical skills supplies type of labor. • Individual firms and workers are ‘wage takers’ since neither can exert any control over the market wage rate. a S b e s=MRC Wage Rate (Dollars) Wage Rate (Dollars) ($10) WC ($10) WC D=MRP (∑ mrps) d=mrp c 0 0 qC QC (5) (1000) Quantity of Labor Quantity of Labor
To produce, or not to produce… That is the question.
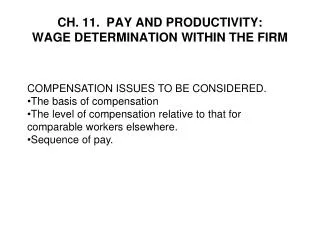
Monopsony1. Single buyer / employer2. Firm is a “wage maker” MRC curve is above the S curve because a higher wage is needed to attract new workers & for current workers. Possible wage rate could be between c and b. In a Monopolistic Market: -- Employer’s marginal resource (labor) cost curve (MRC) lies above the labor supply curve S. -- MRP=MRC at point b. -- Monopolist hires Qb workers (compared with Qc under competition). -- Shown by point c on S, it pays only wage rate Wb (compared with the competitive wage Wc). MRC b a ● c
Monopsony Model • Monopsony • Upward-Sloping Labor Supply to Firm • MRC Higher Than the Wage Rate • Equilibrium Wage and Employment Graphically…
Monopsony Model Monopsonistic Labor Market MRC S b a Wage Rate (Dollars) Wc Wm c MRP 0 Qc Qm Quantity of Labor Examples of Monopsony Power
Three Union Models • 1) Demand Enhancement Model • Increase Product Demand • Increase Productivity • Alter the Price of Other Inputs S Increase In Demand Wu Wage Rate (Dollars) Wc D2 D1 Qu Qc Quantity of Labor
Three Union Models • 2) Exclusive or Craft Union Model • Restricted Immigration • Reduced Child Labor • Encouraged Compulsory Retirement • Shorter Hour Workweek • Exclusive Unionism • Occupational Licensing Graphically…
Three Union Models • Exclusive or Craft Union Model S2 S1 Wage Rate (Dollars) Decrease In Supply Wu Wc D Qu Qc Quantity of Labor
Three Union Models • 3) Inclusive or Industrial Union Model • Inclusive Unionism S b a Wage Rate (Dollars) Wu e Wc D Qu Qe Qc Quantity of Labor
Minimum Wage • Minimum wage legislation is less likely to have an adverse effect in monopsonistic markets. • Critics of min. wage laws argue that it reduces employment. • If min. wage is set too high, some labor markets can expect a surplus of labor. • Increases in the Federal min. wage during the 1990s saw smaller decreases in teenage employment than in previous min. wage hikes. • Unions support a higher min. wage because it makes less-skilled workers less substitutable for union workers. • Some supporters of the min. wage say it has a positive employment effect due to reduced turnover rates, higher efficiency, and therefore increased productivity.
Wage Differentials Education Levels and Individual Annual Earnings Educational Attainment Professional Degree Annual Earnings (Thousands of Dollars) Bachelor’s Degree Associate’s Degree High School Diploma Age
Annual Average Wages Occupation Wage Differentials Average Annual Wages in Selected Occupations, 2005 Surgeons Aircraft Pilots Petroleum Engineers Financial Managers Law Professors Chemical Engineers Dental Hygienists Registered Nurses Police Officers Electricians Travel Agents Barbers Retail Salespersons Recreation Workers Teacher Aides Fast Food Cooks $177,690 135,040 97,350 96,620 95,570 79,230 60,620 56,880 47,270 45,630 37,750 24,700 23,170 22,420 21,100 15,500 Wage differentials can arise from both the demand -side & supply-side of labor markets. Source: Bureau of Labor Statistics, 2006
Annual work hours (2004)