Download
1 / 37
370 likes | 551 Vues
Sumeet Patil 1 S. K. Pattanayak 2 , K Dickinson 3 , J-C Yang 3 , C. Poulos 3 1 NEERMAN, Mumbai (formerly RTI International) 2 Duke University, USA (formerly RTI International) 3 RTI International, USA.

E N D
Sumeet Patil 1 S. K. Pattanayak 2, K Dickinson 3,J-C Yang3, C. Poulos 3 1 NEERMAN, Mumbai (formerly RTI International) 2 Duke University, USA (formerly RTI International) 3 RTI International, USA 3ie Delhi Seminar SeriesShame or SubsidyWhat explains the impact of Total Sanitation Campaign
Study Team Partners • Rajiv Gandhi Drinking Water Mission, Govt of India • Orissa State Water and Sanitation Missionand Department of Rural Development – • World Bank – Funders • WHO, USAID, UNICEF, ICMR - Multidisciplinary technical advisory group • RTI International – Principal investigating agency • Duke University – Analysis and publication phase • NEERMAN – Analysis and publication phase • TNS Mode – Survey agency
Overview of Presentation • Policy Context for Study (4 slides) • Study Objectives (1 slide) • Intervention (3 slides) • Methodology and Implementation (9 slides) • Results (12 slides) Approximately, 45 minutes
Race against Time Source: WSP 2009 calendar
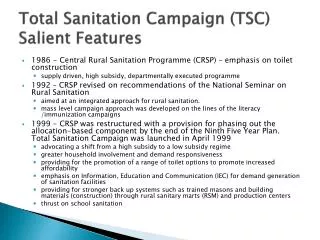
Policy Context for Study • Child Diarrhea - key underlying link for India’s MDG targets • Sanitation is expected to break fecal-oral transmission and thus improve health • Universal access to toilets (no open defecation) by 2022 is a goal of Nirmal Bharat Abiyaan (NBA) • Heated comparison between supply “pushed” subsidy based TSC and CLTS based demand driven “no subsidy” based approaches • Limited evidence to guide implementers and policy makers
Govt M&E/MIS data highly unreliableSource: Chambers and Von Medeazza (2013): working paper
Policy Context for Study • Evidence to make determination is very thin • Impact evaluation in sanitation sectors (are (were) few • Cross-sectional assessments (lacking baseline, control, statistical power) • Need for rigorous impact evaluation • 2005 RCT. Hammer and Spear (2013). Working Paper • 2006 RCT. Pattanayak et al. (2009). This paper • 2011 RCT. Patil et al. (2013). Working Paper • 2011 4-arm QE. We hope that endline happens
Overview of Presentation • Policy Context for Study • Study Objectives • Intervention • Methodology and Implementation • Results
Study Objectives • Whether CLTS based behavior change coupled with subsidy based intervention (TSC) impacts latrine use and child health? • Track the logic chain from inputs to intermediate outputs to outcomes to health impacts • Generate operational knowledge to guide policy • Ability to study the effect of Shame only and shame + subsidy because of the TSC program design feature
Overview of Presentation • Policy Context for Study • Study Objectives • Intervention • Methodology and Implementation • Results
Community-Led Total Sanitation in Bhadrak Knowledge Links
Intervention: Community-Led Total Sanitation (Kar, IDS) • Knowledge alone does not change behavior; need to create “triggering events” and intensive Behavior Change campaign • “walk of shame” • “defecation mapping” • “fecal calculation” • TSC related Incentives for BPL for latrine construction (Rs 1500) • Supply side: masons, rural sanitation mart, know how, motivation, monitoring • Immediate outputs: Out of 20 villages, 9 resolved to end OD, 2 agreed in principle, 5 decided to meet, and 4 were unable to reach a consensus
Overview of Presentation • Policy Context for Study • Study Objectives • Intervention • Methodology and Implementation • Results
Study Design • Randomized Control Experiment • Well controlled. Random and blind assignment of treatment • Sample Size: 20 CLTS villages + 20 control villages and 25 HHs per village (with u5 children) • Baseline (2005) and Endline (2006) • Panel Surveys • 2 rounds, same season, same households • Difference in Difference (DID) estimation of impacts • Difference: Before and After and With and Without
Sample Selection • Selected a district (Bhadrak) with adequate water • Selected blocks (Tihidi & Chandbali) without prior TSC • Restricted villages to have >70 HHs and < 500 HHs • Restricted to 1 village per GP to reduce spill over • Selected 40 villages & randomly assigned 20 to treatment • Listed and mapped all households in 40 villages • Randomly selected and surveyed 25 households with child < 5 yrs in each village
Data: Measurements • Outputs, Outcomes, Impacts: • Household pit latrines (IHL): constructed, operational and in-use • Diarrhea frequency & severity (> 3 episodes in 24-hr, 2-week recall) • Child growth (anthropometrics – MUAC, weight, height) • Additional parameters: • Individual - sex, age, class, caste, religion • Household - family size and composition, education, housing conditions, asset holdings, occupation and expenditures, services • Community – roads, electricity, environmental sanitation, employment, clinics, schools, credits, markets • Institutional - main governmental and NGO programs, local government size and composition • Water quality (E. coli & total coliform) – community sources (all), in-house (50%)
Data: Household Survey • Respondent - Primary Care Giver • Water samples collected from approx 50% of surveyed households • Modular questionnaire • Knowledge, Attitudes • Household SEC • Sanitation Behaviors – outputs and outcomes • Hygiene Behaviors • Water Sources and their use • Water Treatment/safety behaviors • Food safety behaviors • Environmental conditions – HH and community • Budget constraints • Community Participation
Data: Community Survey • Respondent – sarpanch, GP member, Informal leader, Doctor, etc • Water samples collected from up to 10 in-use drinking water sources • Modular questionnaire design • Background: population, households, area, arable land, major crop grown • Public infrastructure: roads, water supply, sanitation, hygiene, electricity, clinics, schools, STD booths, telegraph offices, post offices, credits and markets • Environmental sanitation: general cleanliness, drainage, animal and household waste, use of water sources, open defecation practices • WSS scheme: Swajaldhara, piped water, hand pumps, etc • Development Programs: Health, education, women support etc • Economy: employment opportunities, major governmental and NGO programs, prices • Local government: structure, composition, activities
Survey Implementation - I • Schedule & Resources • 1 month of data collection to catch the monsoons!! • Field Teams – RTI (3 + 1 consultant) and TNS (30 field people + 2 researchers) • Focus groups • Pre-testing (2 rounds of 50 household surveys) • Training (8 days. Mix of in-class and field practice)(manuals prepared) • Supervision: Supervisors executives Managers Researchers. Back checks, spot checks.
Survey Implementation - II • Data Processing • On field editing, 100% scrutiny before data entry • CSPro based data entry • Cross-tabulation based cleaning • WQ Samples • 50% HHs and up to 10 in use sources. • Sterilized bottles • Cold chain transport to lab within 24 hours
Overview of Presentation • Policy Context for Study • Study Objectives • Intervention • Methodology and Implementation • Results
% Households owning & using Toilets(by intervention and year) DID= 26%-0%= 26%*** I indicates the 95% confidence interval. 26% 0%
Shame or Subsidy? • Triple Difference to get the relative effect of shame and subsidy • BPL = Subsidy + Shame and APL = Shame alone • DID for BPL – DID for APL = 34.2 – 20.7 = 13.5% • 13 % effect (about 1/3rd) by the “subsidies”
Is this result replicable elsewhere? • Another RCT in Madhya Pradesh • A scaled up and more “realistic” program • 50% to shame + “less subsidy” and 50% to shame and “more subsidy (by Rs 2700)
Findings from Mixed Methods - I • Some factors indicate “possibility of sustainability” • Increased satisfaction with sanitation situation • Increased belief that improving sanitation is the family’s responsibility • Lack of knowledge of the “germ theory” is not the most important BUT privacy and dignity are key • Households prioritize. Toilets may be “our” priority, not theirs: 80% want health dispensary, 59% roads. Compare to 7-9% for water supply and sanitation
Findings from Mixed Methods - II • Support structure – NGOs, district officials, involvement of triggering team, village institutional capacity are important success factors • Subsidies are tricky business • may have created an incentive for NGOs to “cut corners” and produce lower quality latrines • Concern that subsidies in general defeat the sense of self-reliance • Will subsidy be counteractive in long term? • How and when you give subsidies will matter • Community based incentives (e.g. NGP) instead of individuals? • Is “post” incentives practical for poor population?
7 years later… • Credible evidence that “shaming” works • BUT, so do subsidies • BUT, does the relative contributions depend on “intensity” of CLTS or amount of subsidy? • Seems to be continued increase in toilet coverage • BUT, what about use? And toilet maintenance? • BUT, will we reach 100% open defecation free status? • BUT, what about health impacts? • 7 year later, we still stare at above critical questions without credible answers
Thank You • Sumeet Patil: srpatil@neerman.org • Other papers • Pattanayak et al. (2010), “ “How valuable are environmental health interventions?...” Bull WHO, 88:535-542. • Pattanayak et al. (2009), “Shame or subsidy revisited:…” Bull WHO, 87:1-19. • Pattanayak et al. (2009), “Of taps and toilets….”, J of Water and Health, 7(3): 434–451. • World Bank (2011). “Of Taps an Toilets”. WB report on Evaluation of CDD program in RWSS.