Download
1 / 19
190 likes | 309 Vues
Employing GIS Technology For Mosquito Larvae Surveillance and Control. FGGM WNV Prevention Program. Equipment Hardware/Software. Trimble GeoExplorer3 data receivers Trimble Pathfinder Office Software Used to set up data files in receivers ArcView GIS software. Site Description.

E N D
Employing GIS Technology For Mosquito Larvae Surveillance and Control FGGM WNV Prevention Program
Equipment Hardware/Software • Trimble GeoExplorer3 data receivers • Trimble Pathfinder Office Software • Used to set up data files in receivers • ArcView GIS software
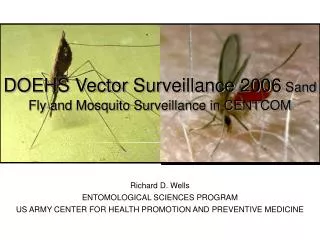
Site Description • Ft. Meade located almost midway between DC and Baltimore • 5560 acre urban/industrial setting with open space • 66 miles of paved road 1,575 buildings • Golf courses, athletic fields, lawns, parade fields, playgrounds, parks, cemeteries, office buildings and residential communities
GIS Process • Data Dictionary uploaded into receivers • Site • Description (manhole, inlet, standing water etc.) • Wet (yes, no) • Maintenance (good, clogged, debris) • Area ID (numeric value assigned to area) • Larvae • Present (yes, no) • Altosid Briquette ( numeric amount) • Bti Briquette (numeric amount) • Larvae collected (yes, no)
Process • Data is collected in the field by technicians and entered into receivers • Data is downloaded from receivers back at office • Data is exported into ArcView shapefiles • Data can be queried by attributes through ArcView to select any known value in data dictionary and displayed on aerial overheads of the installation or installation CAD drawings
Six Positive Pools Traps HAGT and HAGT-5 Adult Mosquito Pesticide Treatment Area
Summary • GIS data system is saving an enormous amount of time and reducing errors in missed survey points • Technician’s surveillance points can be easily viewed in relation to the map • Data points can be queried as to pesticide use, larvae found, storm water maintenance issues, etc. • Concentrations of larvae can be easily viewed and mosquito trapping/control efforts can be directed toward those areas
This system replaces the topo map/spreadsheet system we were using in the past to track mosquito larvae sites and larviciding efforts • Previous year’s data can be easily queried and State larviciding permitting process should be less arduous the following year • Future data layers: • Dead bird locations (species, condition, tested) • Trap locations • Trap type and trap data (mosquito count, positive pools yes/no)
Questions? Kevin R. Fay Installation Pest Management Coordinator Fort Meade, Maryland 301-677-6023/2521 fayk@emh1.ftmeade.army.mil