Download
1 / 6
60 likes | 194 Vues
This document provides an overview of various principles of system analysis, focusing on software development life cycle models such as Waterfall, Spiral, and Rapid Application Development (RAD). It outlines essential methodologies, including data flow diagrams, entity-relationship diagrams, and flowcharts. The benefits of structured analysis and design, such as minimizing project timelines, improving software quality, and enhancing productivity, are discussed. Additionally, it highlights key drivers behind system development, such as legislative changes, the need for growth, and competitive pressures in the market.

E N D
Various principles of system analysis Wasim Akram
Introduction • System analysis is a organized way of sorting problems mainly deals with the software development activities.
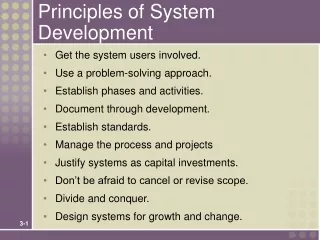
Life cycle model System life cycle is an organizational process of developing and maintaining systems. It helps in create a system project plan, because it gives overall list of processes required for developing a system. Waterfall model The development runs through a number of phases and once you have completed and checked it you cant go back it runs down like a waterfall. Spiral -The spiral model is a software development process combining elements of both design and prototyping-in-stages, in an effort to combine advantages of top-down and bottom-up concepts. Also known as the spiral lifecycle model. The spiral model is large and mainly used for expensive projects. Rapid Applications Development (RAD) This cycle is where there is only 4 stages to make the process faster because they need it asap
Development tools & Techniques Development tools are the programs and utilities that create applications. Data flow diagrams- is a graphical representation of the flow of data between processes it shows what goes in , how its changed and what comes out. • Data flow is represented by a labelled arrow • Processes are represented by labelled circles • Information sources are in boxes • Files are represented by a double line Investigation methods – you could ask some one face to face in an interview but before you go to the interview create a questionnaire. Entity relation ship diagram -An entity-relationship diagram is a graphic that illustrates the relationship between entities in a database, the diagrams often use symbols to represent three different types of information. Boxes are commonly used to represent entities. Diamonds are normally used to represent relationships and ovals are used to represent attributes Flow charts-Flow charts are diagrams which show things linked in a orderly way, with branches according to a number of decision choices.
Potential benefits of carrying out a structured analysis and design activity • There’s no risk of project running over time. • Good software quality • More organized because its in stages • Can keep cost to a minimum or a budget • Increased productivity by meeting all business requirements on time.
key drivers Development of new systems can bring problems and delays for example, • Changes in legislation- a change in legislation that requires organisations to develop new or adapt new systems and processes. • Need for growth- all businesses want or need to grow to turn over a bigger profit in order do this they will need to plan effectively • Improved employee productivity - making the system easier and faster for workers to use • Keep up with competitors- they need to make sure that they have all there software up to date and keep upgrading. • Legal requirements such as health and safety