Calibration Strategies for MAC Simulator: Understanding CCA Level Effects in Residential Scenarios
This presentation explores the effects of CCA (Clear Channel Assessment) levels within a MAC (Medium Access Control) simulator, particularly in a residential scenario. The study analyzes various settings to determine optimal CCA levels for achieving both mean and 5% throughput (TPUT). Findings indicate that CCA levels significantly impact performance metrics and that it is challenging to optimize both mean and peak performance simultaneously. The integration of this research into future MAC simulator calibration is proposed to enhance accuracy and effectiveness.

Calibration Strategies for MAC Simulator: Understanding CCA Level Effects in Residential Scenarios
E N D
Presentation Transcript
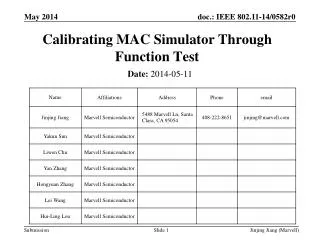
Proposed Calibration For MAC simulator Authors: Date: 2014-07-12
Introduction • Multiple IEEE presentations have looked at the effects of CCA levels. • See next slide • Many claim significant gain by increasing CCA levels. • Numerous types of scenarios/simulators were used to make these claims • PHY simulator • Real devices • MAC simulator/scenario 3 • This presentation focuses on understanding the effect of changing CCA levels in a residential scenario ( scenario 1) • Simulations are done with a MAC simulator • Detailed MAC modelled • Simple PHY abstraction • Optimal CCA levels for both mean and 5% TPUT are found for a variety of settings. Barriac et al (Qualcomm)
Previous Contributions on CCA levels Barriac et al (Qualcomm)
Simulation Setting I Example of one drop Floor 1 Floor 2 Floor 3 Barriac et al (Qualcomm) • Residential Scenario • IEEE residential scenario baseline • Less apartments modelled for faster run times • Expect comclusions will not change • 1 STA per AP • 2x5x3 apartments • 30 APs ; 30STAs ; • Pathloss as specified in 11ax Simulation Scenarios document • 1 80 MHz channel • Results averaged over multiple random drops of APs and STAs locations
Simulation Setting II • Simulation Details: • DL only Data traffic (+ UL BAs) • Full buffer UDP • Default Tx Power: 20 dBm per antenna (AP), 15 dBm ( STA) • Antenna Gain: 0 dBi APs, -2dBi STAs • Rate Control: • MCS per link chosen to maximize long term goodput • MAC modelling • MAC is fully modelled • Deferral according to 11ah CCA rules • OBSS packets deferral only if RSSI > ED (assume BSS ID (color) in PPDU • ED level controls deferral on a network level • Nodes on the same 80 MHz channel have the same primary channel • PHY modelling • Pathloss, shadowing, (pathloss as in SS document, shadowing w sd 5dB) • no fading. • Long term PER curves based on ChD • 1x1 (tx antennas x rx antennas) Barriac et al (Qualcomm)
Tests Run • Using ChD PER curves: • Reuse 1 default power levels • Reuse 1, 6 dB higher tx power levels • 6 dB higher power models total power when 4 antennas • Using AWGN PER curves: • Reuse 1 default power levels • Reuse 1, 6dB higher tx power levels • 6 dB higher power models total power when 4 antennas. Barriac et al (Qualcomm)
Results with CHD PER curves Gwen Barriac (Qualcomm)
TPUT as a function of CCA for Reuse 1 • Optimal CCA for mean: -72 • Optimal CCA for 5% point: -92 Barriac et al (Qualcomm)
TPUT as a function of CCA for Reuse 1, with 6 dB higher Tx Power at both AP and STA • Optimal CCA for mean: -72 • Optimal CCA for 5% point: -82 Barriac et al (Qualcomm)
Possible Simultaneous mean & 5% TPUT Reuse 1, default Tx Power , chD PER curves July 2014
Summary of Results so far ( chD PER curves) • For default power case, the optimal mean TPUT comes with a 70% loss in 5% point. • It can be difficult to optimize for both mean and 5% point simultaneously. Barriac et al (Qualcomm)
Note: Chan D curves better reflect reality. AWGN curves run for understanding of how simulator reacts in different settings. RESULTS WITH AWGN PER CURVES Qualcomm
Reuse 1, Default TX power AWGN curves. • Optimal CCA for mean: -62 • Optimal CCA for 5% point: -92 Barriac et al (Qualcomm)
Reuse 1, 6 dB higher Tx Power , AWGN curves • Optimal CCA for mean: -62 • Optimal CCA for 5% point: -82 Barriac et al (Qualcomm)
Possible Simultaneous mean & 5% TPUT Reuse 1, 6 dB higher Tx Power , AWGN curves Barriac et al (Qualcomm)
Summary of Results w/ AWGN • Difficult to optimize for both mean and 5% point simultaneously. • Optimal mean can come with 95% loss in 5% point Barriac et al (Qualcomm)
Comparison of Optimal CCA levels for AWGN and Chan D PER curves • Changing PER curves has large effect on optimal CCA level for mean • Changing Power level also affects optimal CCA • Optimal CCA level sensitive to parameters. Barriac et al (Qualcomm)
Conclusions: • Optimal CCA levels are highly dependent on parameter settings • example, Tx Power, PER curves • Difficult to get simultaneously optimize both mean and 5% point Barriac et al (Qualcomm)
Additional Considerations • We would like to propose that the rate control used in these studies be included in the EM document for use with the MAC simulator and integrated simulator. • See document xxxxx • We would also like to propose that the deferral method used in these studies be used for the next stage of MAC simulator calibration. Barriac et al (Qualcomm)