Download
1 / 20
230 likes | 581 Vues
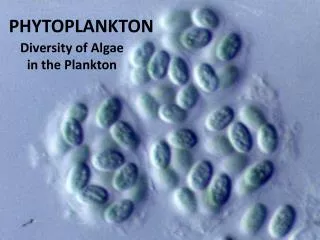
The Initiation of the NA Phytoplankton Bloom. Emmanuel Boss (in close collaboration with M. Behrenfeld). Sverdrup, H. U. 1953. J. Cons. Perm. Int. Explor. Mer . 18: 287-295. ‘ Blooming ’ : P/ t>0. In the oceans:. When phytoplankton are mixed too deep they cannot bloom.

E N D
The Initiation of the NA Phytoplankton Bloom. Emmanuel Boss (in close collaboration with M. Behrenfeld)
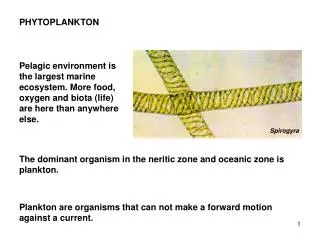
Sverdrup, H. U. 1953. J. Cons. Perm. Int. Explor. Mer. 18: 287-295. ‘Blooming’: P/t>0. In the oceans: When phytoplankton are mixed too deep they cannot bloom. NB: P – ML integrated phytoplankton biomass
The Critical Depth Hypothesis attempts to explain what initiates a vernal (spring) bloom (not what controls its magnitude or duration). Sverdrup, H. U. 1953. J. Cons. Perm. Int. Explor. Mer. 18: 287-295. Production/respiration Winter critical point Spring b e b e b e a a a f d MLD c Depth f d, f MLD c Net population growth is now possible - bloom initiated MLD c d Sverdrup’s ‘respiration’ = grazing + sinking + phytoplankton respiration + all other losses abcd > aef abcd = aef abcd < aefd
Digression: Bloom in a Bottle How do we assess growth rate from observations
Digression: Bloom in a Bottle • To understand what causes a bloom, it is necessary to first identify when a bloom starts • The start of a bloom should not be defined by biomass - e.g., when biomass = X mg m-3 or when biomass is Y% above annual median • Using biomass can lead to the wrong start date and association of bloom initiation with the wrong environmental forcing • Bloom initiation implies a change in the rate of growth – for Sverdrup it was the beginning of positive net growth • An easy way to get a first-order sense of rate changes is to plot biomass on a logarithmic scale Growth Phase 5% > median Net growth rate = r = ln(C1/C0) = slope of log plot t1 – t0
Assessing accumulation rate of phytoplankton within the ML from surface observations: Within the ML (p- phytoplankton concentration): w+=dh/dt – entrainment velocity. If we simply assume:
Phytoplankton accumulation starts before ML restratifies Shallow Deep Starting now in July Annual average cycles of net population growth for each bin show similar patterns, with some variations in magnitude of features Behrenfeld, 2010
In-situ observations of phytoplankton bloom • Coverage under clouds • Vertically resolved Chlorophyll and Phytoplankton Carbon (bbp) • Accounting for entrainment & detrainment • 3 indices of MLD • Advection issues Boss et al., 2008
Optical profiling drifter data confirm satellite findings and also allow direct accounting for vertical biomass variability and entrainment. Boss and Bherenfeld, 2010
Satellite and field data show that phytoplankton biomass starts increasing when environmental conditions are going from bad to worse …. How is this possible?
How is this possible? *m = NPP /(hp) m * NA-5 - Latitude range: 45o – 50oN • A net specific growth rate of 0.02 implies approximately 1 division per month • Typical winter C = 4 – 8 mg m-3, Typical spring C peak = 25 – 70 mg m-3 • NA bloom requires 2 – 4 doublings over 3 - 4 months, or average r of 0.009 to 0.03 d-1
Aside: an alternative theory strong mixing weak mixing P(z) P(z) Not supported by in-situ observation showing accumulation in biomass as MLD deepens
…so, back to our earlier question… What causes a bloom?
Digression: Dilution Experiments Implies that rate of loss to grazing is density dependent. Rather than Sverdrup’s: Something like: * Landry & Hassett 1982 Mar. Biol. 67, 283-288 Landry et al. 1995 Mar. Ecol. Prog. Ser. 120, 53-63 Where H = herbiovres
= symbol for all grazers (note: similar dynamics apply for viruses) The ‘Dilution-Recoupling Hypothesis’ Summer Spring Autumn Winter Behrenfeld and Boss, 2014, ARMS
Ecosystem models provide a closer look at what is going on, and, in particular, link to climate.
Link between maximal MLD and maximal spring biomass : Spring biomass depends on maximum MLD in winter. This is also responsible to nutrient inventory (though these are not limiting) Temperature is also linked to MLD depth in the winter (another mechanism that can decouple zooplankton) Climate has an impact on production through stratification Bherenfeld et al., 2013
Summary • The streetlight analogy – we form our world view with the measurements we have (e.g. hydrography+chl+light) – need to measure more ecological parameters controlling loss. • Shifts in taxonomic dominance are another essential feature of blooms that needs to be addressed (e.g. iron seeding experiments) • Small scale correlated physical/biological processes may have significant impact on the mean evolution of the bloom. They are currently unresolved. • The bloom initiation is only one part of the bloom story; Maximum productivity occurs when biomass is maximum.
How do we generalize to other blooms or areas without blooms? Behrenfeld and Boss, 2014, ARMS