Download
1 / 41
410 likes | 541 Vues
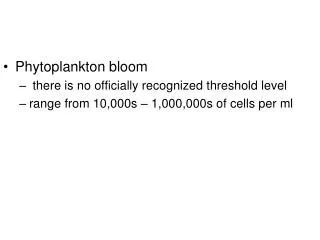
Phytoplankton bloom there is no officially recognized threshold level range from 10,000s – 1,000,000s of cells per ml. Primary Production: Definitions and P vs. I. Outline Review Light Beer’s Law Pigments Photoadaptation Photosynthesis Primary Productivity P vs. I Curves.

E N D
Phytoplankton bloom • there is no officially recognized threshold level • range from 10,000s – 1,000,000s of cells per ml
Primary Production: Definitions and P vs. I Outline Review Light Beer’s Law Pigments Photoadaptation Photosynthesis Primary Productivity P vs. I Curves
More Aquatic Habitats (Vertical) Coastal Neritic Oceanic Euphotic zone 25m EPIpelagic 1% Light Depth 200m 100m Continental Shelf mesopelagic Permanent Thermocline 1000m Continental Slope Bathypelagic Not shown: Seasonal Thermocline (varies, 10 – 400 m, depending on season and location) Abyssopelagic Abyss … Trench
What happens to absorbed light?Photosynthetically active radiation (PAR) 400 – 700 nm or visible lightAbsorbed PAR
What happens to absorbed light?Photosynthetically active radiation (PAR) 400 – 700 nm or visible lightAbsorbed PAR • Scattered back out into the atmosphereCan be detected by sensors in air or orbit
What happens to absorbed light?Photosynthetically active radiation (PAR) 400 – 700 nm or visible lightAbsorbed PAR • Scattered back out into the atmosphereCan be detected by sensors in air or orbit • Absorbed by waterHeats it up
What happens to absorbed light?Photosynthetically active radiation (PAR) 400 – 700 nm or visible lightAbsorbed PAR • Scattered back out into the atmosphereCan be detected by sensors in air or orbit • Absorbed by waterHeats it up • Absorbed by plant pigmentsPhotosynthesis
What happens to absorbed light?Photosynthetically active radiation (PAR) 400 – 700 nm or visible lightAbsorbed PAR • Scattered back out into the atmosphereCan be detected by sensors in air or orbit • Absorbed by waterHeats it up • Absorbed by plant pigmentsPhotosynthesis • Absorbed by dissolved materialsPhotochemistry
Attenuation = a decrease in the energy of light due to absorption and scattering in the water column • Attenuation coefficient (K) = describes the exponential decay of light with depth within the water column
Irradiance in the Ocean I Beers Law Iz = I0e-kz z Iz = irradiance at depth z I0 = irradiance at surface k = attenuation coefficient (m-1) (k also called absorption or extinction coefficient)
Phytoplankton Pigments • PigmentsOrganic compounds (or organometals) that absorb light. • Pigment – protein (complexes)Include chromophores (pigment molecules) bound covalently to protein structures.
Roles of Pigments • Absorb light energy for photosynthesis(Light Harvesting) • Intercept or dissipate harmful light energy(Photoprotection) • Convert light energy into chemical energy(Photochemistry)
Classes of Pigments in Marine Plants • Chlorophylls • Carotenoids • Biliproteins
Pigment analysis Fluorometer Fluoresces red Shine blue light Chromatography HPLC machine
Classes of Pigments in Marine Plants • Chlorophylls - Porphoryn rings, magnesium in center (light harvesting and photochemistry) • Chl a • Chl b • Chl c
Classes of Pigments in Marine Plants • Chlorophylls - Porphoryn rings, magnesium in center (light harvesting and photochemistry) • Chl a • Chl b • Chl c • Carotenoids – carotenes simple chains of carbon and hydrogen (photoprotection) • Xanthophylls 400-500 nm gives brown color to marine plants • Beta-carotene does not feed energy in but absorbs light for plants (sunscreen) protects phototrap from receiving too many electrons • Fucoxanthin 510-525 nm give diatoms brown, olive-green color
Classes of Pigments in Marine Plants • Chlorophylls - Porphoryn rings, magnesium in center (light harvesting and photochemistry) • Chl a • Chl b • Chl c • Carotenoids – carotenes simple chains of carbon and hydrogen (photoprotection) • Xanthophylls 400-500 nm gives brown color to marine plants • Beta-carotene does not feed energy in but absorbs light for plants (sunscreen) protects phototrap from receiving too many electrons • Fucoxanthin 510-525 nm give diatoms brown, olive-green color • Biliproteins water soluble accessory pigments (reds, blues, purples) (photosynthetic light harvesting only) • Phycoerythrin 500-570 nm, Phycocyanin 550-650 nm (red orange)
400 500 600 700 Absorption of light by Phytoplankton Pigments Visible (PAR)
Photoadaptation • phytoplankton manufacture more chlorophyll • Increase umbrella to catch more of the sun's rays • phytoplankton manufacture accessory pigments • expand the color range over which light can be captured • phytoplankton manufacture a set of pigments called protective pigments (carotenoids) • prevent intense sunlight from damaging the photosynthetic apparatus, wide absorption bands that capture light energy and turn it into heat = photoinhibition
Antenna • Complicated array of accessory pigments (carotenes, xanthophylls, phycobilins) Why do we care about pigments?
Some planktonic algae have large amounts of accessory pigments as well as Chl. What would the benefit be to that cost?
Biogeochemical Perspective on Biological Oceanography • Rate Processes: Chemical transformations in the environmentPrimary productivity (Photosynthesis and Respiration)Remineralization • Concept: Control of rate processes • Concept: Limitation of rate processes
Primary Production (PP) • The amount of autotrophic biomass produced per unit area (or vol) per unit time. PP P – R PP rate is independent of biomass eaten by grazers, lost to sinking, etc. range from 1-5 g C/ m-2/ year-1 (central gyres) to 200-400 g C/ m-2/ year-1 (upwelling areas)
Biomass (B) - The amount of living matter per area or volume g C m-2, mg Chl a m-3 1 m 1 m 1 m
Photosynthesis • Photosynthesis 6CO2 + 6H2 O → C6H12O6 + 6 O2 LIGHT & pigments • Respiration 6CO2 + 6H2 O ← C6H12O6 + 6 O2
Photosynthesis • Photosynthesis 6CO2 + 6H2 O → C6H12O6 + 6 O2 • Respiration 6CO2 + 6H2 O ← C6H12O6 + 6 O2 • Expressed as the RATE per VOLUME of the BIOMASS produced (mg C m-3 h-1) the BIOMASS-SPECIFIC rate: (mg C mg Chl a-1 h-1) <- Assimilation NumberPhotosynthesis can be expressed as: • Amount of carbon fixed OR • Amount of oxygen released
IMPORTANT NOTE: Photosynthesis is not equal to Primary Production Example: Organisms also do RESPIRATION (R) CH2O + O2 → CO2 + H2O + Energy
Gross Primary Productivity (Pg) • Total PP • Net Primary Productivity (Pn) • Gross PP – plant respiration
Primary Productivity (PP) rate • Respiration (R) rate • Photosynthesis (P) rate = mass/area or volume/time mg O2/l/t
Estimating Primary Productivity In a bottle of known volume, incubate for a whole day. P and R → ← R GROSS Primary Production Rate NET Primary Production Rate Pg – R = Pn 1) Measure the increase in oxygen over a given period of time 2) Measure the uptake of labeled carbon (14C) by the phytoplankton.
Measuring Primary Production (PP) photoinhibition
Photosynthesis Is a function of VISIBLE LIGHT Photosynthetically Available Radiation (PAR) Quantity of light that stimulates photosynthesis The relationship between Photosynthesis and Irradiance (PAR) is called the P-I CURVE
Photosynthesis – Irradiance Curve P • P is the photosynthesis rate (matter / volume*time) • I is the irradiance, light intensity (cal cm-2 min-1) 1 cal cm-2 min-1 (PAR) =3.15x10⁻⁴μmol m-2 s-1 Irradiance (I or E)
Photosynthesis – Irradiance Curve Pmax Ik P a Irradiance (I or E) • Pmax is the maximal rate of photosynthesis • Ik is the irradiance saturation parameter (varies for different plants) • a is the initial slope of the P vs. I curve
Photosynthesis – Irradiance Curve Pm b Ib Ik P a • Ib is the irradiance at which photoinhibition occurs • b is the decrease in P with increasing irradiance under photoinhibition. Irradiance (I or E)
Photosynthesis – Irradiance Curve Pm b Ib Ik P a • Changes in a reflect changes in the light harvesting capacity and efficiency of the light reactions of photosynthesis (cellular properties) • Changes in Pm reflect changes in the enzymatic capacity (e.g. the dark reactions of photosynthesis). Irradiance (I or E)
Photosynthesis – Irradiance Curve Pm b Ib Ik P a • Photoinhibition reflects damage (reversible or irreversible) to the photosynthetic system … can be caused by UV damage and excessive visible light flux, modulated by time of exposure. Irradiance (I or E)