Download
1 / 26
260 likes | 457 Vues
Justifying Rail Bias Factor for Houston METRO’s Transit Model. Presentation by Vijay Mahal, HDR Inc Vincent Sanders, Houston METRO May 18, 2009 TRB Applications Conference Houston, Texas. Outline of Presentation. Houston’s Long range Transit Plan- MetroSolutions

E N D
Justifying Rail Bias Factor for Houston METRO’s Transit Model Presentation by Vijay Mahal, HDR Inc Vincent Sanders, Houston METRO May 18, 2009 TRB Applications Conference Houston, Texas
Outline of Presentation • Houston’s Long range Transit Plan- MetroSolutions • Houston’s first Light Rail Line- Phase I • Description • Ridership profile • Houston METRO’s travel model – earlier version • Need for Rail Bias factor • Incorporation of Rail Bias • Model application / Conclusions
Houston METRO’s Long Range Plan • Development of METROSolutions • Voter referendum • Different Phases • The Redline (Phase 1)
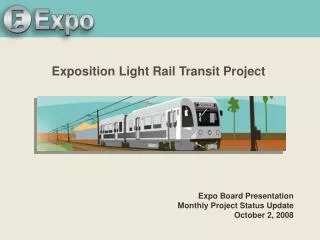
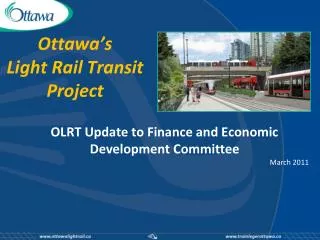
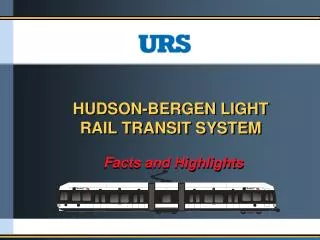
Houston’s first Light Rail • Starter line is 7.5 miles long • 16 stations • Serves very important activity centers (CBD, TMC, UH, HCC, Rice) • High frequency • Uses German-made Siemens cars • Top speeds achievable: 66 MPH
Stations a few blocks apart in CBD and about one mile apart outside of CBD • Uses Clean electric power • Moves large volumes of people • Operates faster than local buses
Forecasts from Earlier Models LRT ridership forecasts made during the 1990s Opening year (2004) forecast= 22,000 2020 forecast = 40,000 Actual ridership in September 2004 = 33,000 Actual current ridership = 44,000 • The Red Line is considered the most successful line in the country. Nov. 2007 Breaks 40 Million boardings Sept. 2008 Breaks 50 Million boardings So, what factors make this line so successful?
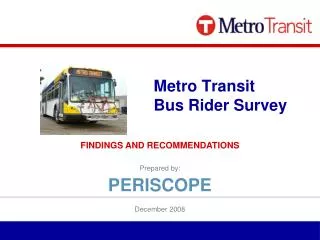
Travel Surveys • 1st Survey in Sept 2004 (elaborate OD survey) • 2nd Survey in November 2004 (Supplemental survey to collect data on new riders) • 3rd Survey in 2007 (OD survey to update model parameters)
The 2004 O/D survey format • 19 Question survey • Basic demographics question were asked age, gender, income, ethnicity, available vehicles • Access-Egress patterns, type of trips, transfer, types of fare media, how long & often have you used transit • One question not asked: Were you a METRO user before METRORail?
Highlights from Survey Survey conducted from November 8th 2004 to November 17th 2004 Total surveys handed out = 13,000 Valid surveys returned = 5,940 (very high response) Percent of new riders (Question 1 of survey) was 37 % Were you a METRO bus/shuttle rider before METRORail opened?
Houstonians Offer Positive Comments • Survey response: • 90 % comments were positive • 3 % neutral, 7 % negative • 36 % wanted immediate system expansion • Most cited reasons for positive response • reliability • comfort / smoothness of ride • faster than bus
Houston METRO’s original Mode Choice Model Light Rail data was never a part of Houston METRO’s mode choice model estimation • Primary Data Sources • 1985 Home Interview Survey • 1990 Journey to Work Census data • 1995 and 2001 On-board OD surveys • Periodic ride check data • LRT came into existence in January 2004 • None of the data set contained the rail attributes
Earlier Planning Studies Major Planning Studies for this region began in the mid 1990s For the Redline, • Alternative Analysis & Environmental documents in progress • Travel forecasts were needed urgently for a mode that didn’t exist • Modifications made to the mode choice model to accommodate LRT (quick fix)
Mode-Specific Constants Utility equations Original Model U LB = C1x Inveh TT + C2 x Out-of-veh TT + C3 x Fare U CB = K 1 + C1x Inveh TT + C2 x Out-of-veh TT + C3 x Fare Revised Model U LB = C1x Inveh TT + C2 x Out-of-veh TT + C3 x Fare U CB = K 1 + C1x Inveh TT + C2 x Out-of-veh TT + C3 x Fare U EX = K 2+ C1 x Inveh TT + C2 x Out-of-veh TT + C3 x Fare U LRT = C1x Inveh TT + C2 x Out-of-veh TT + C3 x Fare
Purpose of Mode Specific constant • Most models consider travel time, travel costs and some measurable service characteristics (# of Xfers) • Visibility, comfort of ride, reliability, passenger amenities etc. – are non-quantifiable and not considered • In theory, mode specific constant is supposed to represent the non-quantifiable factors • Misuse of Mode Specific constant : correction factors (for calibration purposes)
Underestimation of LRT forecasts LRT forecasts were significantly underestimated when its mode bias constant was zero • Opening year (2004) forecasts = 22,000 daily boardings • Horizon year (2020) forecasts = 40,000 daily boardings • Current (2009) actual ridership = 44,000 daily boardings • What was the most likely reason for the underestimation? • Survey results clearly demonstrated Houstonians perceive LRT as a Premium mode. So, a mode specific constant was introduced to represent the Rail Bias.
Incorporating Rail Bias Factor Methodology • Started with a rail bias factor of 0.33 used in the old Minneapolis and San Diego models. In terms of IVTT, this equals 6.73 min in our models. • Run model with and without LRT network • Analyze ridership and new trips and compare them to survey results • Increase bias factor if necessary and repeat the process • Final factor was 0.50 (equal to 10.2 minutes of IVTT)
Model Application Application results
Rail Bias Impacts on New Starts projectsThe North Corridor Extension
Rail Bias Impacts • Ridership projections increased by about 20 to 25 percent • User Benefits increased by about 15 percent • Distribution of user benefits improved • Most diagnostic statistics from SUMMIT reasonable
Conclusions • Travel surveys reveal Houstonians perceive LRT as a premium mode. Its ride quality, reliability, station amenities are as important to them as its travel times and frequency. They have a positive Bias towards rail. • The rail bias factor in Houston is worth approximately 10 min of IVTT in comparison to local bus mode • Rail Bias can improve User Benefits and ridership- in our case about 15 to 20 percent