Download

1 / 14
140 likes | 237 Vues
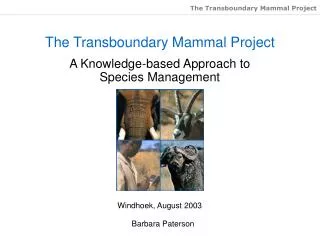
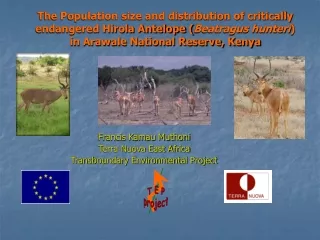
T E P. project. The Population size and distribution of critically endangered Hirola Antelope ( Beatragus hunteri ) in Arawale National Reserve, Kenya. Francis Kamau Muthoni Terra Nuova East Africa Transboundary Environmental Project. Hirola Profile. Diet: mostly grass Weight: 75 - 160 kg

E N D
T E P project The Population size and distribution of critically endangered Hirola Antelope (Beatragus hunteri) in Arawale National Reserve, Kenya Francis Kamau Muthoni Terra Nuova East Africa Transboundary Environmental Project
Hirola Profile • Diet: mostly grass • Weight: 75 - 160 kg • Mean group size: 7- 8 • Gestation: 7 months • Sexually mature: 2 years • Habitat: seasonally arid region of grassy plains btwn acacia bush and coastal forest 10th SCGIS Conference, Monterey, CA
Study Area • Area: 540 Km2 • Only in-situ conservation initiative for hirola • 6 species of conservation interest • Gazetted 1973 • Protection collapsed 1988 10th SCGIS Conference, Monterey, CA
Historical Range of Hirola • 38,400 Km2 in Kenya and Somalia (1960’s) • 19,158 Km2 in Kenya (1960’s) • Current 9,177 Km2 • 14,000 in 1960’s • 1,000 - 2000 Today 10th SCGIS Conference, Monterey, CA
Transects are lined down considering areas of interest or relevance Transect counts are performed by moving along the identified line on foot/vehicle All observations are recorded in specific forms and geo-referenced with GPS Transect counts are performed on the same, day and at the same time each month Transect Methodology 10th SCGIS Conference, Monterey, CA
Population Estimates • Using N= (nZ/T)2W Where: • N = Population size in the whole survey zone. (Dahiye, 1999) • n = Population size in transects (monthly average) • Z = total area of the survey zone • T = Length of the transect • W= Width of the transect. N= (45*540/70)0.2 10th SCGIS Conference, Monterey, CA
Population Size & Density • Total Sighted: 534 • Groups: 87 • Mean: 45 • Population Size: 69 • Density: 0.13/Km2 • Mean Groups Size: 6.1 10th SCGIS Conference, Monterey, CA
Seasonal Distribution • Total Individuals - Dry 59% - Wet 41% • Groups Sightings - Dry 68%- Wet 32% 10th SCGIS Conference, Monterey, CA
Distribution of hirola in ANR. 10th SCGIS Conference, Monterey, CA
Habitat Preferences 10th SCGIS Conference, Monterey, CA
Human-Livestock-Wildlife interfaces 10th SCGIS Conference, Monterey, CA
Livestock Grazing 10th SCGIS Conference, Monterey, CA
Threats • Habitat degradation • Drought • Poaching • Competition with livestock • Predation • Inbreeding 10th SCGIS Conference, Monterey, CA
T E P project Acknowledgements Thank You Email: frakamuus@yahoo.com 10th SCGIS Conference, Monterey, CA