Download
1 / 65
690 likes | 894 Vues
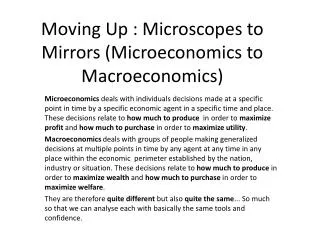
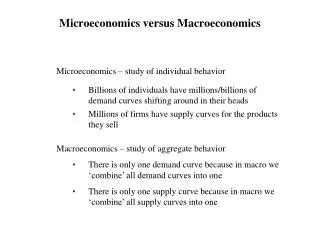
Microeconomics – study of individual behavior. Microeconomics versus Macroeconomics. Billions of individuals have millions/billions of demand curves shifting around in their heads. Millions of firms have supply curves for the products they sell. Macroeconomics – study of aggregate behavior.

E N D
Microeconomics – study of individual behavior Microeconomics versus Macroeconomics • Billions of individuals have millions/billions of demand curves shifting around in their heads • Millions of firms have supply curves for the products they sell Macroeconomics – study of aggregate behavior • There is only one demand curve because in macro we ‘combine’ all demand curves into one • There is only one supply curve because in macro we ‘combine’ all supply curves into one
The Demand Curve A DemandCurve shows the quantity of a good that consumers will purchase at alternative prices, holding all else constant. Quantity Demanded (QD)is the amount of a good consumers will purchase at a given price (P), holding all else constant. A movementalong a demand curve is the change in quantity demanded that occurs when its price changes, holding all else constant The Law of Demand is the economic principle that says that the lower the price of a good the larger the quantity consumers wish to purchase, holding all else constant. How do we test this theory? We collect data by asking questions like: How many Big Macs will you buy per week when the price is P = $10.10? How many Big Macs will you buy per week when the price is P = $0.10?
According to our data, When P0= $0.10, QD = 112 The Demand Curve 10.10 Price 12 Quantity
According to our data, When P1= $10.10, QD = 12 The Demand Curve 10.10 Price 0.10 D 112 12 Quantity
The following equation fits these two points. P = 11.3 - 0.1Q The Demand Curve Big Mac Demand Moving from this point … … to this point is amovement alonga demand curve 10.10 Price 0.10 D 112 12 Quantity
The elasticity of Big Mac demand is computed as follows. The Demand Curve Big Mac Demand 10.10 Price 0.10 D 112 112 12 12 Quantity
The elasticity of Big Mac demand is computed as follows. The Demand Curve Big Mac Demand 10.10 10.10 Price 0.10 0.10 D 112 12 Quantity
The elasticity of Big Mac demand is computed as follows. The Demand Curve Big Mac Demand 10.10 Price 0.10 D 112 12 Quantity
A shift of a demand curve is a change in the location of the demand curve If demand of a good increases when income increases, the good is a normal good The Demand Curve Big Mac Demand Price 2.30 D D’ 90 135 Quantity
A shift of a demand curve is a change in the location of the demand curve If demand of a good decreases when income increases, the good is an inferior good The Demand Curve Big Mac Demand Price 2.30 D D 65 90 Quantity
A shift of a demand curve is a change in the location of the demand curve If the price of McDonald’s fries falls (QD for fries would increase), demandfor Big Macs increases. Big Macs and fries are complements. The Demand Curve Big Mac Demand Price 2.30 D D’ 90 145 Quantity
A shift of a demand curve is a change in the location of the demand curve If the price of Burger King Whoppers falls (QD for Whoppers increases), demand for Big Macs decreases. Big Macs and Whoppers are substitutes. The Demand Curve Big Mac Demand Price 2.30 D D’ 75 90 Quantity
A shift of a demand curve is a change in the location of the demand curve Taste/preference shifts: The low carbohydrate diet craze might have changed how people felt about eating foods high in carbohydrates and calories. The Demand Curve Big Mac Demand Price 2.30 D D’ 75 90 Quantity
A shift of a demand curve is a change in the location of the demand curve If the population increases, demand for Big Macs might increase as well. The Demand Curve Big Mac Demand Price 2.30 D D’ 90 105 Quantity
The Supply Curve A Supply Curve (or simply supply) shows the quantity of a good that firms will produce at alternative prices, holding all else constant. Quantity Supplied (QS) is the amount of a particular type of good firms will want to produce at a given price, holding all else constant. A movement along a supply curve is the change in quantity supplied that occurs when its price changes, holding all else constant. The Law of Supply is the economic principle that says that the higher the price of a good the larger the quantity firms wish to produce, holding all else constant. We test this theory by asking questions. You have on old oil well in Mississippi which produces 10,000 barrels per year. There are 9 other people in the area that have identical oil wells. How many barrels of oil will you pump out of the ground if the crude oil price is P = $15? How many barrels of oil will you pump out of the ground if the crude oil price is P = $115?
According to our data, When P = $15, QS = 0 Revenue = P·Q = 0 The Supply Curve Price 15 0 Quantity
According to our data, When P = $115, QS = 100,000 Revenue = P·Q= $11,500,000 The Supply Curve Crude Oil Supply S 115 Price 15 0 100,000 Quantity
The following equation fits these two points. P = 15 + 0.001Q The Supply Curve Crude Oil Supply S 115 Moving from this point … …to this point is amovement alonga supply curve Price 15 0 100,000 Quantity
S’ A shift in supply is a change in the location of the supply curve If the price of related good (natural gas) falls (QS of natural gas falls), supply of crude oil increases. The Supply Curve Crude Oil Supply S Price 85 700,000 350,000 Quantity
S’ A shift in supply is a change in the location of the supply curve If the price of an input to production (workers’ wages) falls, supply of crude oil increases. The Supply Curve Crude Oil Supply S Price 85 700,000 350,000 Quantity
S’ A shift in supply is a change in the location of the supply curve If technology improves (McFlurry Spoon/stirrer), McFlurry supply increases. The Supply Curve McFlurry Supply S Price 2.50 11,400,000 10,150,000 Quantity
S’ A shift in supply is a change in the location of the supply curve If government intervenes by mandating health insurance companies to cover preexisting conditions, the supply of health insurance policies will decrease. The Supply Curve Health Insurance Policy Supply S Price 2.50 84,000 115,000 Quantity
Law of Supply and Demand The Law of Supply and Demand states that in a free market the forces of supply and demand generally push the price toward the level at which quantity supplied (QS) equals quantity demanded (QD). Use the following model to explain why the price of gasoline is so high. Assume the daily demand and supply for gasoline is given by
Law of Supply and Demand Gasoline Market P ($) S D Q (millions)
Law of Supply and Demand Compute the equilibrium price and quantity of gasoline
Law of Supply and Demand Gasoline Market P S D Q (millions)
S Law of Supply and Demand Use supply and demand analysis to explain why gas prices jumped after Hurricane Katrina.How does a spike in gasoline prices encourage Americans to conserve gasoline duringafter natural disasters such as Katrina? Katrina shut down Gulf Coast refineries, pipe lines and Gulf of Mexico deep water oil wells. Gasoline S Demand for gasoline increases because people are trying to get out of harms way or they “hoard”. 3.92 Price 2.50 D D 372 388 Q (millions)
S Law of Supply and Demand Using supply and demand analysis, explain why the government should or should not intervene and impose a price ceiling on gasoline after natural disasters such as Katrina. Suppose the government decides that the P is too high. It may impose a ceiling on the price gas stations charge. Gasoline 3.92 The government’s “good intentions” result in long lines at the gas pump(a shortage). Price 2.50 D 372 Q (millions)
Law of Supply and Demand Using supply and demand analysis, explain how does the Strategic Petroleum Reserve (SPR) contribute to higher gasoline prices. The SPC (underground salt caverns in TX, LA and MS) is the D of E’s emergency supply of oil, holding up to 727,000,000 barrels of crude oil (a 60-day supply). Crude Oil In a past State of the Union, Bush announced he would double the SPR for national security. This increases the price of crude oil. S Price D D Q
S Law of Supply and Demand Using supply and demand analysis, explain how does the Strategic Petroleum Reserve (SPR) contribute to higher gasoline prices. The higher crude oil prices raise the cost of refining gasoline, which decreases its supply. This results in a higher gas price. Gasoline S Price D Q
Gasoline Facts Law of Supply and Demand • In 2005, the U.S. imported 3,695,971,000 barrels of crude oil. • Refineries convert crude oil into gasoline, diesel fuel, asphalt base, heating oil, kerosene. The U.S. has not built a new refinery since 1976. • Gasoline tax in NC amounts to 48.6 cents per gallon, while in NY it amounts to 60.1 cents. 20 gallons of gas/week over 52 weeks means you pay $505.44 in gasoline taxes each year in North Carolina versus $625.04 in New York. • The U.S. economy consumes about 388,000,000 gallons per day. • Or 150,544,000,000 gallons per year • US consumers paid $27.1 billion in Federal gasoline taxes last year at the pump. • Exxon Mobile’s 2007 pre-tax profit was about $70 billion, assuming a 35 percent tax rate, Exxon Mobil’s federal income tax bill was ($70)(0.35) billion = $31.85 billion This is about 10% of all corporate income taxes collected by the federal government.
Why is there a shortage of math teachers? Law of Supply and Demand Mathematics History LS (mathematicians) LS (historians) $60k $30k LD $20k LD 100k 100k shortage surplus
Law of Supply and Demand How does increasing the minimum wage affect workers and firms? Low skilled labor market LS (workers) wmin wmin w* LD (firms) E LF E E* LF unemployment unemployment
Law of Supply and Demand Is there a cost to immigration? Low skilled labor market LS (workers) A flood of low skilled workers into an economy… w* w* LD (firms) E* E*
Law of Supply and Demand Is Lebron James over paid? There are 41 Cleveland home games a season and the stadium the team plays in seats about 20,000 fans. Before Lebron Cleveland averaged 12,000 fans per game at an average ticket price of about $40 per ticket. After Lebron the team nearly sold out every game at an average ticket price of $41 per ticket. Suppose this increase in fan interest is attributable entirely to Lebron (8,000 additional fans do not attend games to see the new white guy sitting at the end of the bench). Demand for Cavalier home basketball games jumps from DBL to DALas a result of adding Lebron to their roster.
Law of Supply and Demand Is Lebron James over paid? Low skilled labor market S Lebron is drafted… 41 40 DAL DBL 12000 20000 Empty seats
Law of Supply and Demand Is Lebron James over paid? Low skilled labor market S Revenue per home game: 41 40 DBL DAL 12000 20000
Law of Supply and Demand Is Lebron James over paid? Low skilled labor market S Revenue per home game: 41 40 DBL DAL 12000 20000
Law of Supply and Demand Is Lebron James over paid? Total revenue for all 41 home games: Marginal Revenue of adding Lebron (MR): Adding one Lebron increases total home game revenue by $13.94 million while the marginal cost of hiring one Lebron (MC) is $6 million a year. Cleveland would love to continue hiring more Lebrons until MR = MC.
Law of Supply and Demand Is Lebron James over paid? How many additional fans would come to Cleveland home games to watch me sit at the end of the bench? Maybe my mom, wife and grandmother. This increase in the quantity demand is so small that it would have no effect on the price of a ticket. Marginal Revenue of adding me (MR): Adding one Hal increases total home game revenue by $4,920 while the marginal cost of hiring one Hal (MC) is $250,000 a year. Since MR < MC Cleveland would not hire an additional Hal. In fact, the team prefers cutting him from the squad.
Macroeconomics Models • Production Possibilities Frontier • Consumption Possibilities Frontier • Free Trade • Aggregate Demand and Aggregate Supply (PowerPoint lecture 4) • Aggregate Demand is the relationship between the quantity of real GDP demanded and the price level when all other influences on expenditure plans remain the same • Aggregate Supply is the relationship between the quantity of real GDP supplied and PL when all other influences on production plans remain the same • AS and AD determine equilibrium real GDP and the PL
Production Possibilities Frontier • A Production possibilities frontier (PPF) is a depiction of all different combinations of two goods that a society can produce with fixed amount of resources and the best available technology. • The PPF models scarcity and choice. • The PPF models opportunity cost (OC). OC of using a resource in a particular way is the value of the resource in its best alternative use • Assumptions • only produce two goods • use best available technology • use all available resources • The PPF puts 3 features of production possibilities in sharp focus: • Attainable and unattainable combinations • Efficient and inefficient production • Tradeoffs and free lunches
Production Possibilities Frontier The President’s health care proposal B E C A D 98 90 74 0 20 28 36 Is point A efficient? Is point A attainable? A is not efficient because it lies inside the PPF A is attainable but is associated with high unemployment
Production Possibilities Frontier The President’s health care proposal B E C A D 98 90 74 0 20 28 36 Is point B efficient? Is point B attainable? Point B is attainable, and is efficient, meaning more of one good cannot be produced without producing less of something else. Points C and D are also efficient production levels. Unemployment equals its natural rate when the economy is its PPF.
Production Possibilities Frontier The President’s health care proposal B E C A D 98 90 74 0 20 28 36 What is the opportunity cost (OC) of moving from D to C? If we want 16 more units of health care we have to give up 8 units of all other goods (tradeoff) Health care is not a free lunch because its OC = 0.5units of all other goods
Production Possibilities Frontier The President’s health care proposal B E C A D 98 90 74 0 20 28 36 What is the opportunity cost (OC) of moving from C to B? If we want 8 more units of health care we have to give up 8 units of all other goods (tradeoff) Health care is not a free lunch because its OC = 1 units (of all other goods)
Production Possibilities Frontier The President’s health care proposal To get one more health care unit we have to give up 1unit of all other goods B E C A D 98 90 74 To get one more health care unit we have to give up a half unit of all other goods 0 20 28 36 Why does the OC of health care increase as we move up along the PPF to the left? As an economy increasingly specializes in HC, the OC of producing HC increases because we are using more and more resources that are poorly suited to produce HC.
Production Possibilities Frontier The President’s health care proposal B E C A D 98 90 74 0 20 28 36 Is point E attainable? E is not attainable (in the short-run) because this economy does not have the resources to produce at point E. Point E is attained when new resources and technologies are found.