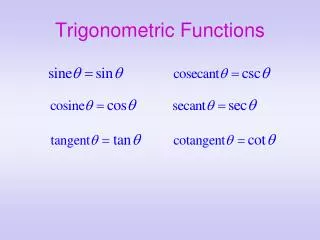
Graph Trigonometric Functions
Graph Trigonometric Functions. Objective: SWBAT graph sine, cosine and tangent curves. 2. The range is the set of y values such that. 5. Each function cycles through all the values of the range over an x -interval of. Properties of Sine and Cosine Functions.

Graph Trigonometric Functions
E N D
Presentation Transcript
Graph Trigonometric Functions Objective: SWBAT graph sine, cosine and tangent curves
2. The range is the set of y values such that . 5. Each function cycles through all the values of the range over an x-interval of . Properties of Sine and Cosine Functions Properties of Sine and Cosine Functions The graphs of y = sin x and y = cos x have similar properties: 1. The domain is the set of real numbers. 3. The maximum value is 1 and the minimum value is –1. 4. The graph is a smooth curve. 6. The cycle repeats itself indefinitely in both directions of thex-axis.
x 0 cos x 1 0 -1 0 1 y = cos x y x Graph of the Cosine Function Cosine Function To sketch the graph of y = cos x first locate the key points.These are the maximum points, the minimum points, and the intercepts. Then, connect the points on the graph with a smooth curve that extends in both directions beyond the five key points. A single cycle is called a period.
x 0 2 3 0 -3 0 3 y = 3 cos x max x-int min x-int max y (0, 3) ( , 3) x ( , 0) ( , 0) ( , –3) Example: Sketch the graph of y = 3 cos x on the interval [–, 4]. Example: y = 3 cos x Partition the interval [0, 2] into four equal parts. Find the five key points; graph one cycle; then repeat the cycle over the interval.
y y = sin x x y = sin x y = 2 sin x y = –4 sin x reflection ofy = 4 sin x y = 4sin x The amplitude of y = a sin x (or y = a cos x) is half the distance between the maximum and minimum values of the function. Amplitude amplitude = |a| If |a| > 1, the amplitude stretches the graph vertically. If 0 < |a| > 1, the amplitude shrinks the graph vertically. If a < 0, the graph is reflected in the x-axis.
For b 0, the period of y = a sin bx is . For b 0, the period of y = a cos bx is also . period: period: 2 y x y period: 2 x period: 4 The period of a function is the x interval needed for the function to complete one cycle. Period of a Function If 0 < b < 1, the graph of the function is stretched horizontally. If b > 1, the graph of the function is shrunk horizontally.
y = sin(–x) x y y x y = cos (–x) Use basic trigonometric identities to graph y = f(–x) Graph y = f(-x) Example 1: Sketch the graph of y = sin(–x). The graph of y = sin(–x) is the graph of y = sin x reflected in the x-axis. Use the identity sin(–x) = – sin x y = sin x Example 2: Sketch the graph of y = cos(–x). The graph of y = cos (–x) is identical to the graph of y = cos x. Use the identity cos(–x) = – cos x y = cos (–x)
2 2 period: = 3 y ( , 2) x (0, 0) ( , 0) ( , 0) ( ,-2) x 0 0 2 –2 y = –2 sin 3x 0 0 Example 3: Sketch the graph of y = 2 sin(–3x). Example: y = 2 sin(-3x) Rewrite the function in the form y = a sin bx with b > 0 y = 2 sin (–3x) = –2 sin 3x Use the identity sin (– x) = – sin x: amplitude: |a| = |–2| = 2 Calculate the five key points.
To graph y = tan x, use the identity . y Properties of y = tan x 1. domain : all real x x 4. vertical asymptotes: period: Graph of the Tangent Function Tangent Function At values of x for which cos x = 0, the tangent function is undefined and its graph has vertical asymptotes. 2. range: (–, +) 3. period:
Example: Find the period and asymptotes and sketch the graph of y 1. Period of y = tanx is π . x 3. Plot several points in Example: Tangent Function 2.Find consecutive vertical asymptotesby solving for x: Vertical asymptotes: 4. Sketch one branch and repeat.
y To graph y = cot x, use the identity . Properties of y = cot x x 1. domain : all real x 4. vertical asymptotes: vertical asymptotes Graph of the Cotangent Function Cotangent Function At values of x for which sin x = 0, the cotangent function is undefined and its graph has vertical asymptotes. 2. range: (–, +) 3. period:
The graph y = sec x, use the identity . y Properties of y = sec x 1. domain : all real x x 4. vertical asymptotes: Graph of the Secant Function Secant Function At values of x for which cos x = 0, the secant function is undefined and its graph has vertical asymptotes. 2. range: (–,–1] [1, +) 3. period: 2
To graph y = csc x, use the identity . y Properties of y = csc x 1. domain : all real x x 4. vertical asymptotes: Graph of the Cosecant Function Cosecant Function At values of x for which sin x = 0, the cosecant functionis undefined and its graph has vertical asymptotes. 2. range: (–,–1] [1, +) 3. period: 2 where sine is zero.