Download
1 / 28
280 likes | 607 Vues
MIS and Management Science Applications for Revenue Management. MIST 8990 UGA Evening MBA Program August 20, 2005. Presentation by: Patrick G. McKeown. Revenue Management Defined.

E N D
MIS and Management Science Applications for Revenue Management MIST 8990 UGA Evening MBA Program August 20, 2005 Presentation by: Patrick G. McKeown
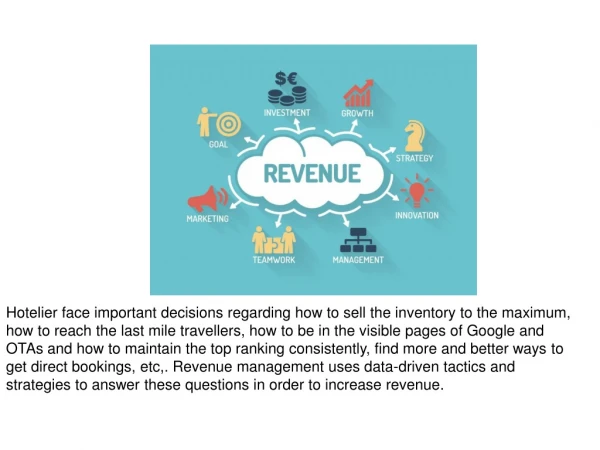
Revenue Management Defined “The application of disciplined tactics that predict consumer behavior at the micromarket level and optimize product availability and price to maximize revenue growth.” - Robert G. Cross Revenue Management: Hardcore Tactics for Market Domination
Revenue Management Defined Selling the right product to the right customer at the right time through the right channel for the right price
Revenue Management Core Concepts 1.Sell to micro markets. 2. Exploit product value cycles. 3. Save products for the most valuable customers. 4. Focus on market-based pricing. 5. Focus on price rather than costs when balancing supply and demand. 6. Make decisions based on knowledge, not supposition. 7. Continually re-evaluate revenue opportunities.
Nine Steps to Success • Evaluate market needs • Evaluate your organization and processes • Quantify the benefits (Use simulation) • Enlist Technology • Implement Forecasting • Apply Optimization (Use Linear programming) • Create Teams • Execute, Execute, Execute • Evaluate Success
Underlying Disciplines for RM • RM is based on two primary disciplines: • Management Science (MS) • Management Information System (MIS) • It is a unique blend of these two disciplines
Management Science and MIS • Management science or MS (also known as operations research) is the use of mathematical models and solution procedures to solve organizational problems • MIS refers to the systems that provide information to support operations, management, and decision-making functions in an organization
MS and MIS • MS is the older of the two fields of study dating back to the 1940’s and includes: • Mathematical optimization, simulation, stochastic modeling, statistical analyses, forecasting, cluster analysis, queuing analysis, and so on • MIS has its beginnings in the late 1960’s and includes: • Transaction processing systems (TPS), database management systems (DBMS), data warehousing systems, decision support systems (DSS), CRM, electronic commerce, and so on
Application of MS and MIS to Revenue Management • Let’s look at some ways that MS and MIS are used in revenue management • To do that, recall the RM process from previous presentations
The Revenue Management Process Segment the Market Predict Customer Demand Optimize Price Recalibrate Dynamically Segmentation based on purchasing behavior, not just current or past classifications Forecasts of demand and capacity at product/price level Continually monitor performance and update market response Mathematically determine capacity availability and price that maximizes expected profit
MIS in the Revenue Management Process Segment the Market Predict Customer Demand Optimize Price Recalibrate Dynamically Use transaction processing to collect data, data base and data warehousing to store and analyze it Use DSS to analyze data from DW to create demand model Use database and DW to provide data for optimization Use TPS, DBMS, and DW to continually monitor performance and update market response
MS in the Revenue Management Process Segment the Market Predict Customer Demand Optimize Price Recalibrate Dynamically Use cluster analysis to find market segments Use simulation to validate demand model and forecasting to forecast future demand Mathematically determine capacity availability and price that maximizes expected profit Rerun LP model on daily basis to revise prices; rerun forecasting model and simulations less frequently
Using MS for Revenue Management • We will consider in this course four of the MS techniques that are used in revenue management • Mathematical programming for determining the best set of prices to assign • Simulation for determining the effect of pricing policies • Forecasting to generate future demand for product • Cluster analysis for segmenting the market • Let’s start with mathematical programming
Draws upon mathematics from Differential calculus (Linear) Algebra Linear Program – assumes all relationships are linear Math Programming • Consists of ... • Objective function to be maximized • Constraints - a system of equations that bind • Enabling technology • High-speed, large scale computing • Optimization software(OSL, CPLEX, Solver)
LP Example • The AHM Corporation has a small plant where they produce two products which we will call A and B. The profit contribution from the two products is $10 and $12 respectively. The products pass through two production departments each with restricted production time. The hours per product and time available in each department are shown below: • Department A B Time Available per month • 2.0 3.0 1500 • 1.0 1.0 600
LP Formulation Maximize 10A + 12B Subject to 2A + 3B < 1500 1A + 1B < 600 A, B > 0
LP Graphical Solution Add First Constraint Units of B 750 500 250 Units of A 500 750 250
LP Formulation Add second constraint Units of B 750 500 250 Units of A 500 750 250
LP Formulation Add Objective Function Units of B 750 500 250 Units of A 500 750 250
Optimum Solution A = 300, B = 300 LP Formulation Determine highest profit feasible solution Units of B 750 500 250 Units of A 500 750 250
LP Applied to Revenue Management • LP is applied to revenue management in the sixth step to success • It is applied because once you determine the prices to charge, you don’t know how many of the scarce resource to allocate to each price group. • By using LP, we determine the optimum allocation, ie, the highest revenue allocation
The OD Problem • Revenue management started in the airline industry in the 1980's where price & availability were managed on a leg basis where a leg is a single takeoff & landing. • The problem with this solution is that demand is at an origin-destination (OD) level. • For example, on an Houston-Atlanta-NYC flight, there is only one OD pair (Houston-NYC) but two legs (Houston-Atl and Atl-NYC) • Want to optimize the OD not the legs
OD Problem (Continued) • Today, airline's have inventory control systems that can better handle OD controls and OD network optimization is now a core technology in Airline revenue management. • Following is an illustrative problem, demonstrating the types of models used in the industry. The 'real' problems are extremely large with millions of OD products to forecast, and thousands of flights (courtesy of Jon Higbee of Manugistics, Inc.)
OD Example Problem • Trans-Europe Airways (TEA) services 5 cities in Europe • Dublin (DUB) • Madrid (MAD) • Frankfurt (FRA) • Rome (FCO) • Moscow (MOW) • TEA operates 8 flights per day using one type of aircraft that has a capacity of 180 passengers • The routes are illustrated on the route map on the next slide. Note that all flights pass through Frankfurt with 4 going in and 4 going out.
Connections The allowable connections and leg capacities are described in the following OD-leg incidence matrix.
The Problem • The pricing department has established fare values for five fare categories and the forecasting group has developed forecasts of demand at these prices for a departure date of November 1, 2005. • You as the lead analyst in the optimization group need use the this data to determine the following: • What is the optimal number of seats to set aside for each OD fare product on each leg?
The Solution • Use the Excel Solver to formulate and solve the problem: • Maximize revenue • Subject to: leg capacities • Revenue = number on each leg x seat price • Leg Capacity = 180 per leg. Note that a seat from DUB to MOW uses capacity on both DUB-FRA and FRA-MOW while DUB to FRA uses only the first leg. • The data and setup for this example are available at http://www.terry.uga.edu/~pmckeown/RevMan05/TEA.xls