NJ Manufacturing Competitiveness
NJ Manufacturing Competitiveness. Proximity to market, value chain for US manufacturing.


NJ Manufacturing Competitiveness
E N D
Presentation Transcript
Proximity to market, value chain for US manufacturing …evidence suggests strongly that physical production activities account for a diminishing share of the final value of manufactured products, with service-related inputs such as research, product design, and marketing becoming more important. Further, the production of many goods is dispersed across multiple locations along global supply chains, making it difficult to determine where value is added. Such shifts pose a challenge to efforts to capture economic value by promoting goods production in the United States. http://forbes.house.gov/uploadedfiles/crs_-_hollowing_out_in_u_s__manufacturing.pdf
Drivers of Manufacturing Competitiveness (US) Source: Deloitte and US Council on Competitiveness 2010 Global Manufacturing Competitiveness Index.
States’ Competitiveness CNBC Business Rankings 2012 Education: measures of K-12 education including test scores, class size and spending; considered the number of higher education institutions in each state. Workforce: education level of their workforce, as well as the numbers of available workers; union membership. While organized labor contends that a union workforce is a quality workforce, that argument, more often than not, doesn’t resonate with business. We also looked at the relative success of each state’s worker training programs in placing their participants in jobs. Tech & Innovation: support for innovation, the number of patents issued to their residents, and the deployment of broadband services. We also considered federal health and science research grants to the states.
http://www.edweek.org/ew/qc/2012/16src.h31.html?intc=EW-QC12-LFTNAVhttp://www.edweek.org/ew/qc/2012/16src.h31.html?intc=EW-QC12-LFTNAV
…but NJ outmigration after high school Source: National Center for Education Statistics http://nces.ed.gov/programs/digest/d10/tables/dt10_232.asp
OEM supply chains shift starting in ‘80s US manufacturing loses 1 million jobs. 2.5M (large firms) 1.2M (small firms) • 89% of NJ’s manufacturing establishments employ 49 or fewer workers (2010) • 33% of NJ’s manufacturing employees work in establishments larger than 500 employees (2010) IMPLICATIONS: Lower value-add/production worker Lower ratio of managers: production workers Fewer professional staff Less R&D Less investment in capital upgrades Less training Lower wages OEM primary customer
Business-funded R&D strong in NJ, but… Science and Engineering Indicators 2012 • NJ R&D Federal Contracts (2011): $7.3 Billion • Lockheed Martin $2.3 billion • Mantech, SAIC www.usinnovation.org
Impact of HQ strength, hollowing out of production in NJ • Know-how and innovation based in production • “design based production” coupling physical production and design
ROA Performance Trends for Top and Bottom Quartiles of US Manufacturing Sectors (1965-2010)
Long-term Topple Rate Trends by US Manufacturing Sector (1965-2010)
Current NJ export profile is 93 percent of New Jersey exporters are small businesses (2009) Manufactured Goods Exports, 2010 (billions) $28.5 Total Jobs in all Sectors Supported by Manufactured Goods Exports 139,400 Export Share of Manufacturing Jobs 18% 2003-2010 Growth of Manufactured Goods Exports 87% Small businesses as Percentage of NJ Exporters, 2009 93% New Jersey Manufacturers Are Engaged in Exporting around the World • Top five U.S. export markets: 40 percent of New Jersey exports (2010). • Canada (20%), South Korea (6%), Mexico (5%), Japan (5%) and Germany (5%). http://www.nam.org/~/media/1DCE95B956204B28A19B814C36A538CE.ashx
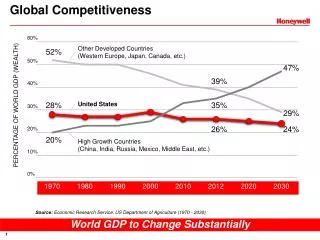
..but not aligned with growth in middle class consumption (2000-2050)
New Jersey facts (2012) www.usinnovation.org • NJ R&D Federal Contracts (2011): $7.3 Billion • Lockheed Martin $2.3 billion • Mantech, SAIC