Graphing Logarithmic Functions
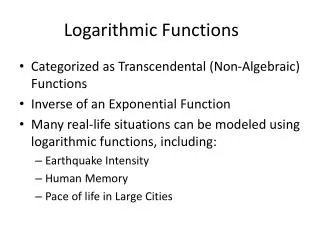
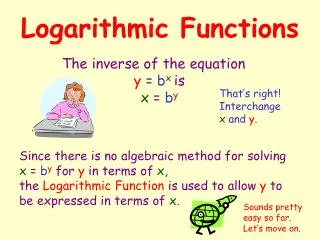
Graphing Logarithmic Functions. MHF4UI Thursday October 25 th , 2012. The Inverse of an Exponential. Recall from the lesson where we learned to graph exponential functions that if we take the inverse we get:

Graphing Logarithmic Functions
E N D
Presentation Transcript
Graphing Logarithmic Functions MHF4UI Thursday October 25th, 2012
The Inverse of an Exponential Recall from the lesson where we learned to graph exponential functions that if we take the inverse we get: If we use the technique we learned to graph any exponential we can graph the inverse: Transpose our two key points from (x,y) to (y,x) Change our asymptote from the line y = c to the line x = c Reflect the general shape and direction on the line y = x
y = x What are the Domain and Range of ?
We Want a Faster Method! The method of applying the inverse will cost us valuable time on a test! Especially if we have to apply transformations to the Exponential graph before graphing it. Let’s now try to determine a method that will enable use to quickly apply to graphing any exponential function.
Looking at the Key Points: Let us consider the function Recall from the graph that our key points were (1,0) and (2,1) If we apply similar logic to logarithmic functions of other bases we will find that there is a pattern in determining these key points. has the key points: has the key points: We can generalize this pattern to find than any logarithmic function will have the key anchor points of:
The General Form of a Logarithmic Function Just like when we found a general form for any exponential function we can use a general form to apply to a logarithmic function. The general form of a logarithmic function is: Where, d will cause the graph to shift up or down d units c will shift the graph left or right c units If c > 0 then we are shifting to the right a will stretch the graph vertically for a value of a > 1 If a is negative, we reflect in the x-axis k will compress the graph horizontally if k > 1 If k is negative, we reflect in the y-axis
Is There an Easier Way? In past grades you learned to apply transformations to graphs, just like when we took the inverse of an exponential. This is also called mapping notation. If the function is of the form: We can apply the following transformation to each point (x,y): We can apply this transformation to our two key points.
How to Graph Logarithms Find your two key anchor points of the function (1,0) and (b,1) Using the general form of transform your key points using: Change your Horizontal Asymptote of y = c to a Vertical Asymptote of the line x = c Determine the behaviours of the graph around the Asymptote and as x∞ or as x -∞ Similarly we can check the values of k and a to determine if: a is negative reflection in the x-axis k is negative reflection in the y-axis Draw the general curve and direction of the graph using all the information we have just found.
What do I need to Show? For a question where you are required to graph a logarithmic function you will be expected to clearly identify: The two key points after you have applied the transformations. The vertical asymptote of the line x = c. The general shape and direction of the function.
Homework Questions: • Textbook Chapter 6.3 • Part A: 1, 3, 6, 7 • Part B: 8, 13