Logarithmic Functions and Graphs
Learn how to write, evaluate, and graph logarithmic functions, the inverses of exponentials. Practice drawing functions and determining domain and range. Explore applications like acidity measurements using pH.

Logarithmic Functions and Graphs
E N D
Presentation Transcript
Logarithmic Functions Essential Questions • How do we write equivalent forms for exponential and logarithmic functions? • How do we write, evaluate, and graph logarithmic functions? Holt McDougal Algebra 2 Holt Algebra 2
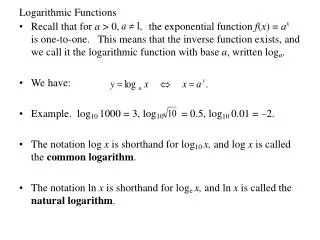
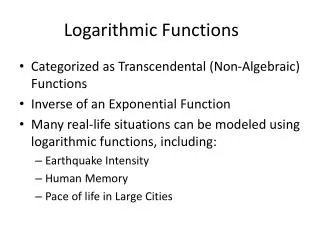
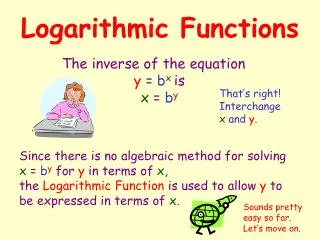
Because logarithms are the inverses of exponents, the inverse of an exponential function, such as y = 2x, is a logarithmic function, such as y = log2x. You may notice that the domain and range of each function are switched. The domain of y = 2x is all real numbers (R), and the range is {y|y > 0}. The domain of y = log2x is {x|x > 0}, and the range is all real numbers (R).
Graph logarithmic functions of the form y = alogb(x – h) + k: (1, 0); (b, a) 1. Graph the 2 points: 2. Move points right/left h, up/down k. 3. Draw vertical asymptote: x = h 4. Draw curve going through 2 points.
Graphing Logarithmic Functions Graph the function. State the domain and range. HA: Domain: Range: All real numbers
Graphing Logarithmic Functions Graph the function. State the domain and range. HA: Left 3 Domain: Range: All real numbers
Graphing Logarithmic Functions Graph the function. State the domain and range. HA: Left 2 Up 1 Domain: Range: All real numbers
Graphing Logarithmic Functions Graph the function. State the domain and range. HA: Up 2 Domain: Range: All real numbers
Graphing Logarithmic Functions Graph the function. State the domain and range. HA: Left 3 Down 2 Domain: Range: All real numbers
Graphing Logarithmic Functions Graph the function. State the domain and range. HA: Reflect across y-axis Right 2 Up 1 Domain: Range: All real numbers
Chemists regularly test samples for acidity, or concentrations of hydrogen ions (H+). Acidity is measured in pH, as given by the function:
Food Application The table lists the hydrogen ion concentrations for a number of food items. Find the pH of each. 7. 8. 9.