Download
1 / 10
100 likes | 253 Vues
A Fiber Optic Spectrometer for Analytical Chemistry in Ionic Liquids. Jonathan N. Pressley Chemical Engineering Undergraduate, University of South Carolina April 29, 2003. Outline. Introduction Relevance of Research Results Future Plans. Introduction. Ionic liquids are Organic salts

E N D
A Fiber Optic Spectrometer for Analytical Chemistry in Ionic Liquids Jonathan N. Pressley Chemical Engineering Undergraduate, University of South Carolina April 29, 2003
Outline • Introduction • Relevance of Research • Results • Future Plans
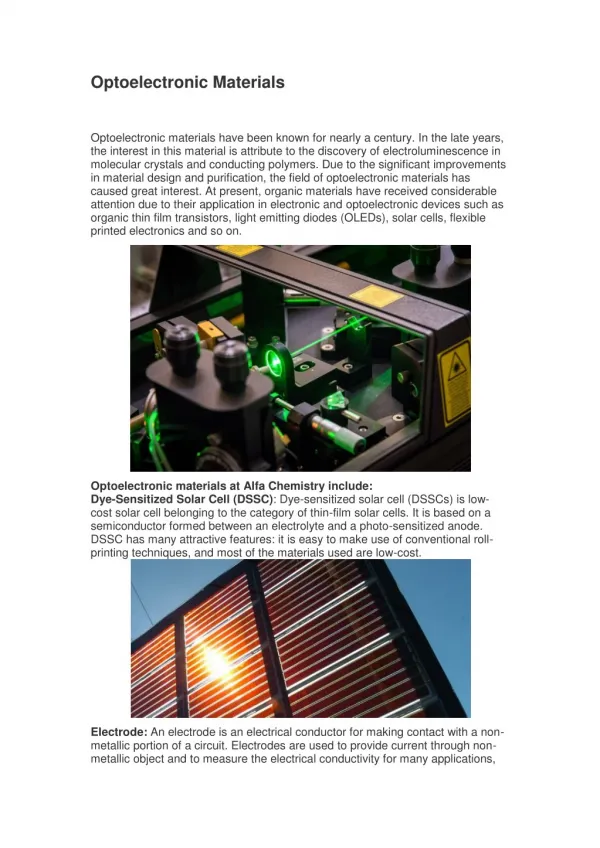
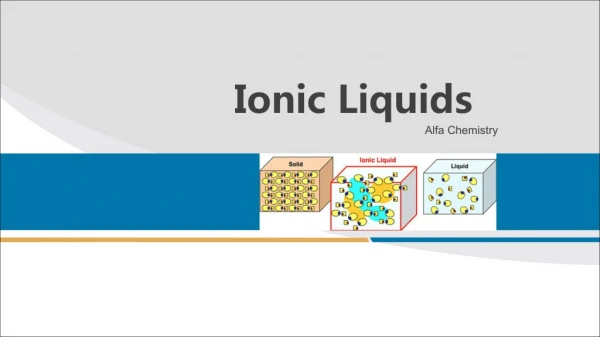
Introduction • Ionic liquids are • Organic salts • Non-flammable • Ionic liquids are used • As a solvent for catalytic and synthetic purposes • As a good electrolyte for electrochemistry • Advantages of using ionic liquids are • Optimization of compound characteristics • Replacement of volatile organic compounds
Relevance of Research • Development of an on-line process to measure polychlorinated hydrocarbon concentration in ionic liquids • Possibly devise system to improve purity of ionic liquids during process
More Light Less Light Absorbance Conceptual Basis of Absorbance
Mirror Light from Source Light to CPU
Future Work • Continue calibration of dip probe with TCB in ethanol at concentrations of 482.2, 417.9, 208.9, 125.4, 104.5, 89.5, and 69.6 ppm • Develop a concentration versus absorbance curve for each of the peak wavelengths • Use dip probe to test ionic liquids • Possibly test an aprotic solvent